Hey Friends and Clients! 
I hope you all had an amazing August! I know this can be a hectic time of year for many, and it’s no different for our family! So, I’ll get straight to the point with this update and dive into the exciting new stats and insights I’m seeing in the market. There’s plenty to cover, so let’s get into it! 

July marks the fourth consecutive month where the Housing Price Index (HPI) for Detached & Attached properties (including Houses, Townhomes, Condos, Duplexes, and Rows) in the Fraser Valley has dropped, following three months of price gains. This was another tough month for sellers, with one of the lowest sales volumes for any August in nearly two decades of recorded history. But there’s plenty more to discuss below! 
To start, sales volume dipped again from June to July (from 1,104 to 942, a -15% decline), which was disappointing for many sellers who had hoped the two consecutive 0.25% interest rate cuts would lead to more buyer activity 
 (what’s happened since the third cut is left to be seen!). Instead, we saw an increase in the number of sellers, as you’ll see in the details below
  . This trend wasn’t what most people expected, especially following a near record-low June and July. For those who have been keeping up with my updates, you might remember this as one of my earlier predictions that has, unfortunately, come true.
What’s crucial now is how this August measures up against the last 20 Augusts. Stay tuned!Let’s dive into the numbers!
Home Prices
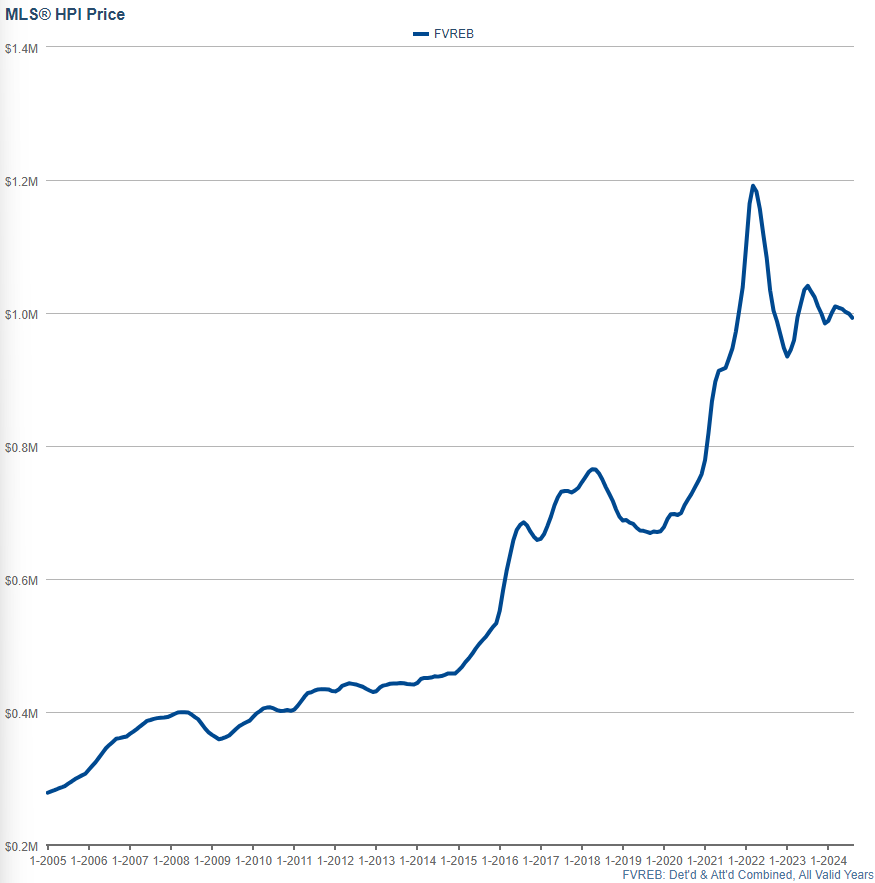
In the Fraser Valley, we’re now seeing the fourth month of decline in the Housing Price Index, covering all property types (Detached, Townhomes, and Condos), following three months of rising prices. For sellers, this continues to be a concern as many were hoping that the interest rate cuts would sustain the upward trend in prices. However, it’s worth noting that despite interest rates being a major factor, prices have dropped in about 80% of the past 19 years between June and August —not necessarily a direct cause, but it’s an interesting point I discovered through deeper analysis. 
August 2024: -0.7% 
July 2024: -0.3%
June 2024: -0.5%
May 2024: -1.0%
April 2024: +0.5% 
March 2024: +1.4%
February 2024: +0.9% (Previously recorded incorrectly as +3.7%)
January 2024: -0.3%
December 2023: -1.5%
November 2023: -1.1%
October 2023: -1.4%
September 2023: -0.9%
August 2023: -0.9%
Sales Volume & Sales Ratio
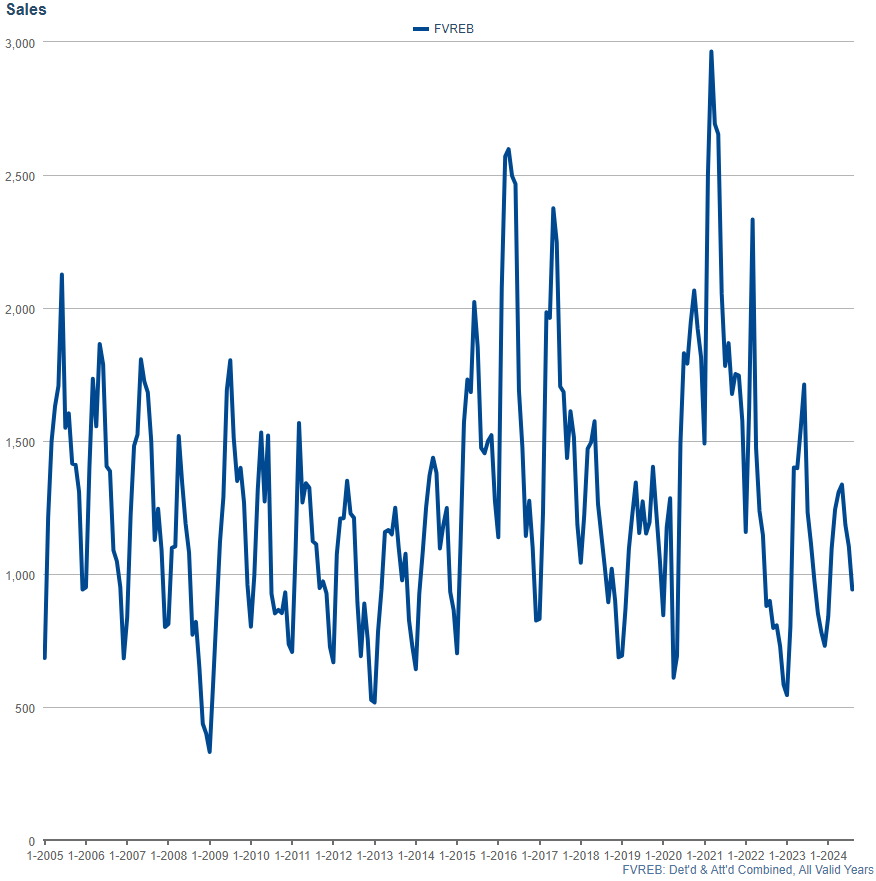
While August experienced a slight dip in prices overall , it also saw a decline in Sales Volume (for both Detached & Attached properties combined), dropping from 1,104 sales in July to 942 in August. This represents a 15% decrease from June 2024 and ranks as the 4th lowest August in the past 19 years of data tracking (July was the 3rd lowest July for comparison.) So, it’s definitely a lot lower than what we’ve typically seen in recent years. Interestingly enough, as you’ll notice below, the number of new listings dropped slightly which was at least nice to see for current sellers .
Active Listings
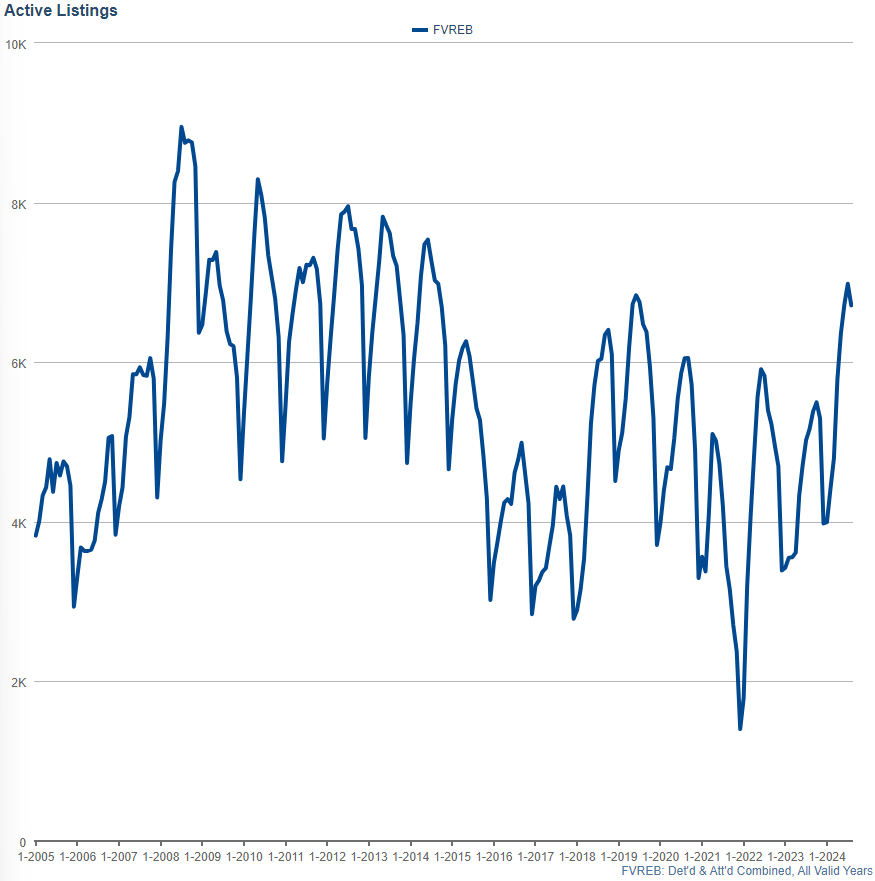
Inventory has finally shown signs of lowering as it came down for the first time after 7 consecutive months of increase… However, it’s important to look at that in context, as nearly every September for the last 19 years had Active Listings Decrease (specifically for Detached and Attached properties combined), with this year’s numbers dropping from 6,982 in July to 6,712 in August, marking a 3.9% decrease… But while July 2024 marked only the 9th highest July in terms of inventory, this August was the 6th highest August for inventory (indicating an average but upward-trending level).
While it’s tough to pinpoint significant trends from the modest increase over the last three months, there has been a noticeable acceleration recently, particularly in areas with high rental property inventory.
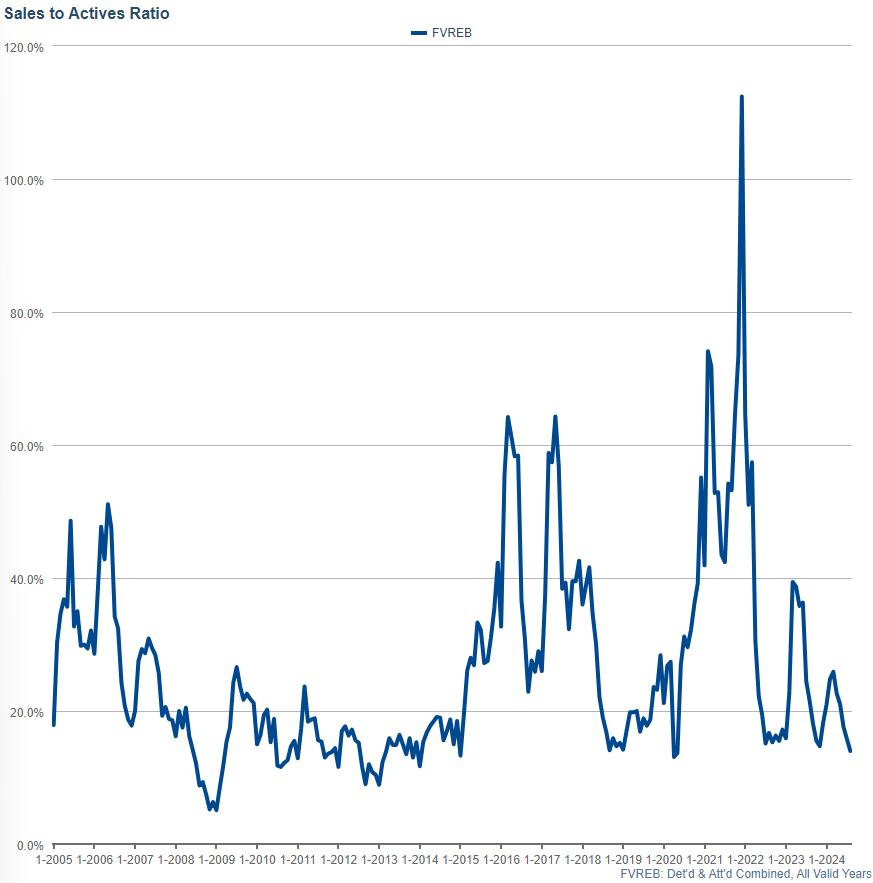
Sales Ratios
(the percentage of active listings that sell in any given area) dropped once more, down to 14.0% from 15.8%. This decline is heavily influenced by PRICE POINT, with sales ratios remaining more favorable for sellers in the lower to mid-price ranges, while activity in the luxury market is almost non-existent. 

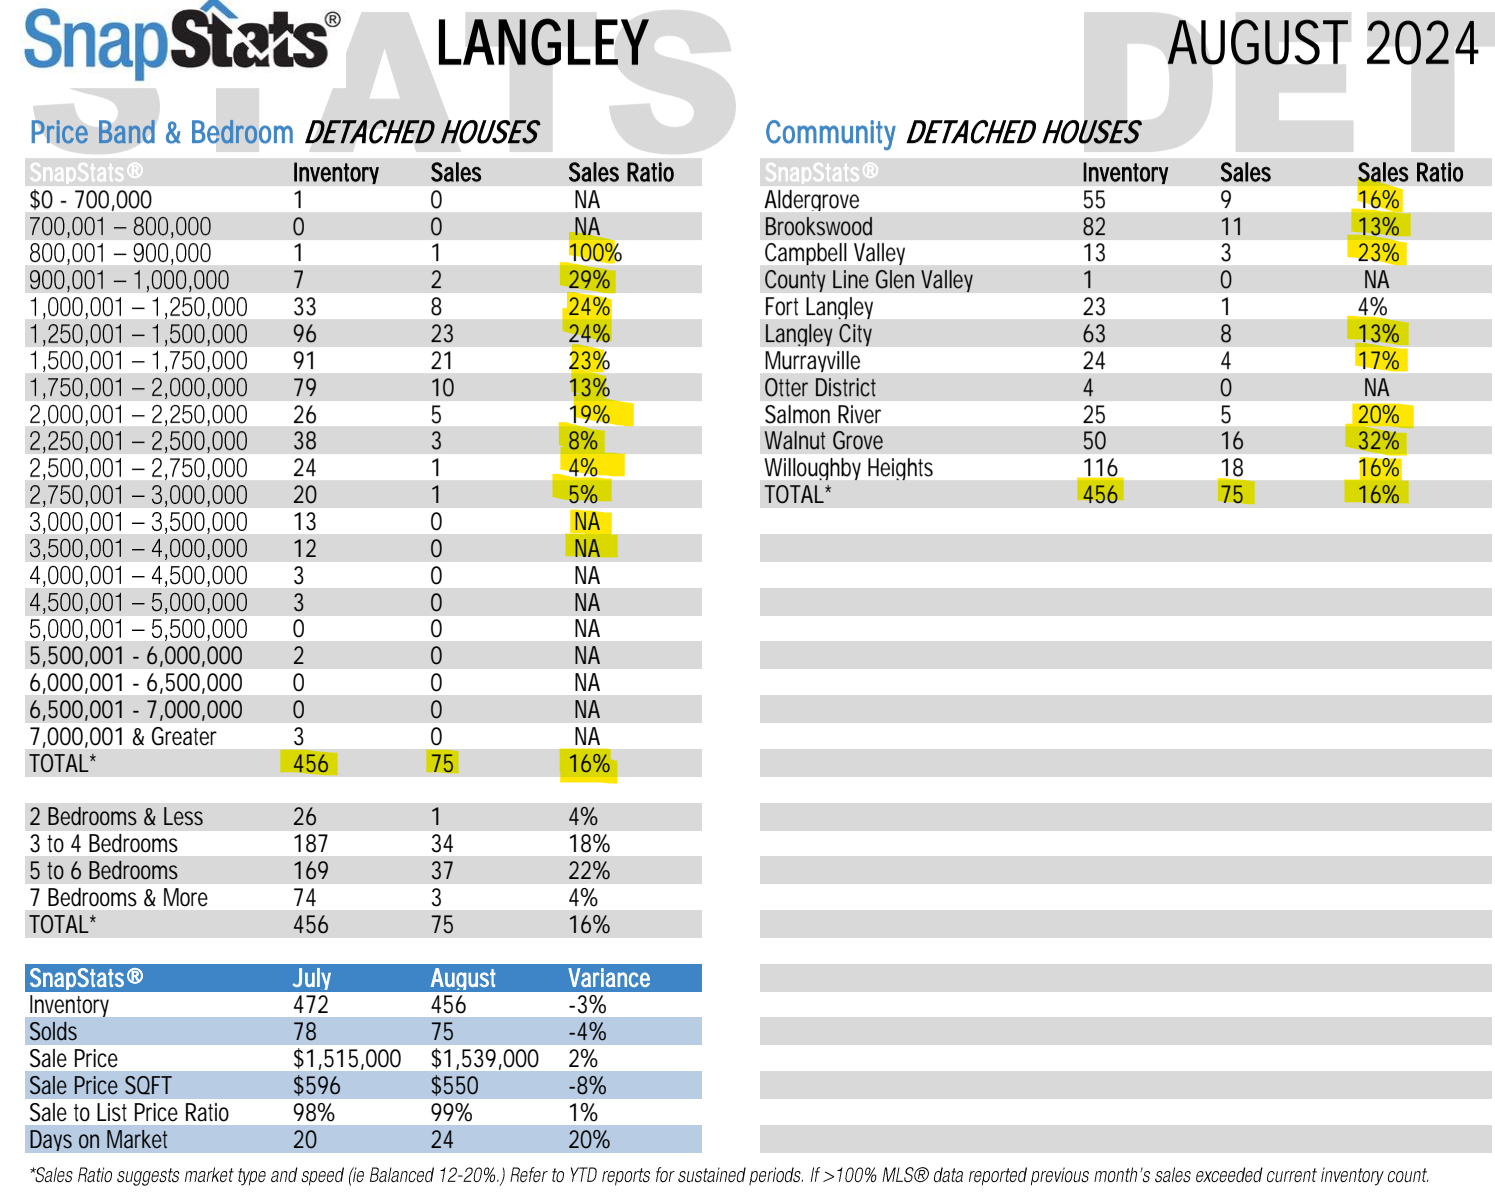
Langley Detached Houses
Just like last month, we’re going to look at a couple of areas in the Fraser Valley, starting with Langley detached houses: 
In August, we saw a continuation of trends at an accelerating pace. While there were slightly fewer listings, there were far fewer sales, resulting in lower ratios everywhere, and the higher up in price you go, the worse the story is. 
Condos and Townhomes
For condos and townhomes, the story is a bit more positive, with many areas still showing a balanced market. The situation hasn’t been quite as challenging as it’s been for higher-priced detached homes or acreages, but sales ratios still fell (stay tuned 2 pics down!).
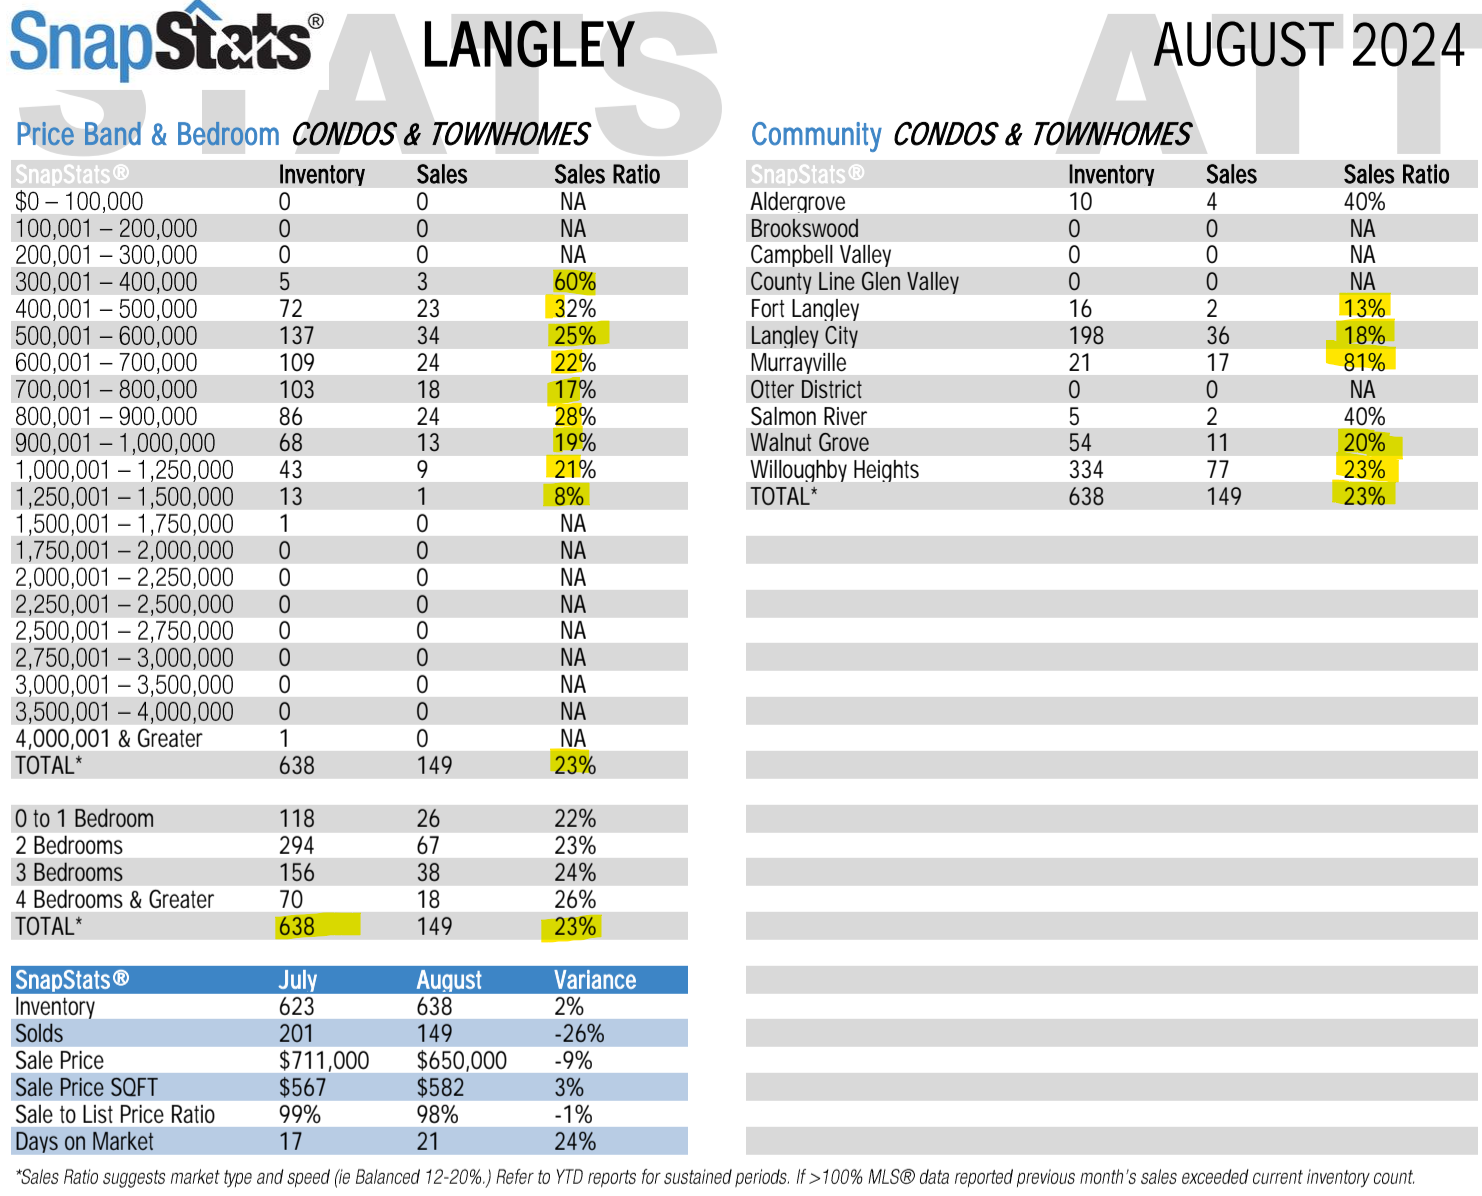
So that’s the Langley Condo and Townhome market that wasn’t looking too bad…but now we’ll have a look at the Overall Fraser Valley Condo Market overall for comparison. The Condo market represents a large portion of the Strata market and that’s what should concern you if you own a condo right now and need to sell it.
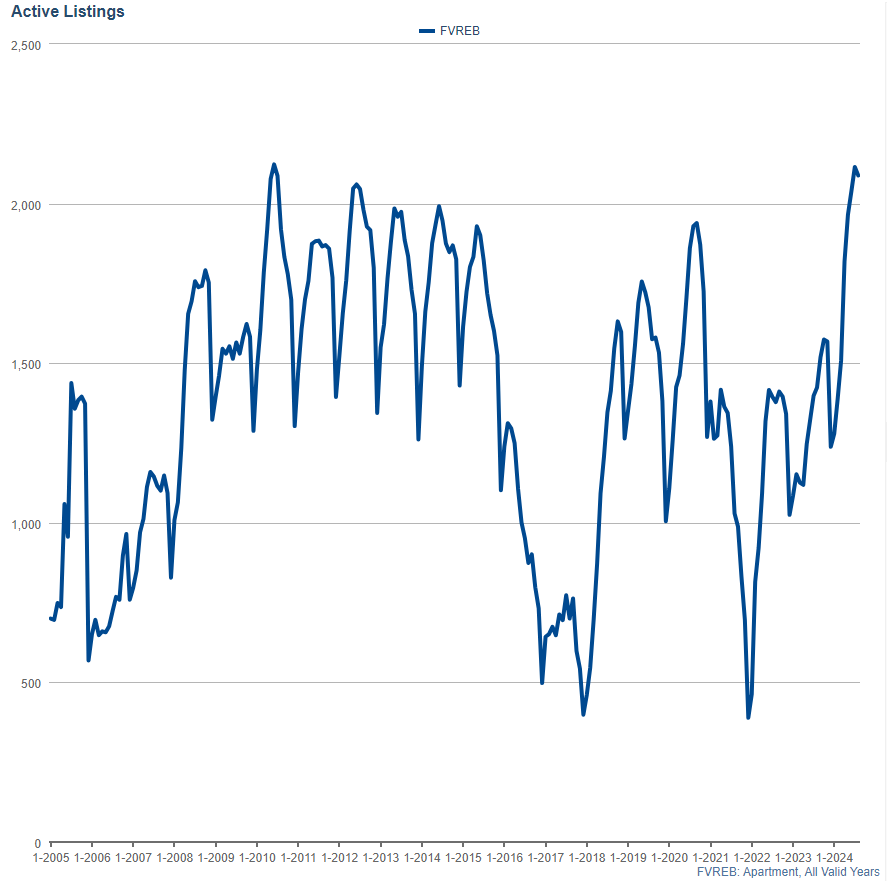
August 2024 is a milestone but not in a positive way. It marks the #1 highest inventory August ever recorded for condos in the Fraser Valley out of 19 Augusts.
For comparison, July was the 3rd highest so this again indicates further softening in the market.
My Forecasting:
Here’s my quick (well, who am I kidding—maybe not so quick!  ) outlook: The two consecutive 0.25% cuts on variable rates might have encouraged more buyers to consider entering the market, but as we’ve seen over the past three months, even more sellers have decided to list their properties . This surge in inventory, especially within the condo market
  , is likely to continue putting downward pressure on prices .
That being said, we just had our third consecutive rate cut this past September 4th, and the jury is still out on how much that’s affecting the market  . It definitely doesn’t hurt, though
  . Rental properties are still so cash-flow negative that they’re simply unaffordable or undesirable for most . The 3 rate cuts in June, July, and now September have (so far) brought more sellers into the market than buyers . But there’s a big difference between seeing 2 cuts in a row vs. 3, so the optimist in me wants to believe this third cut could be the start of a positive trend
  —but it’s still too early to tell, with many other factors to consider .
The rental market is still punishing landlords with these high rates  , resulting in significant negative cash flows . On top of that, there have been dramatic changes in legislation regarding rentals (and short-term rentals) in our province
  , making it much less desirable to own rental properties
  . As I mentioned last month, I even had to sell one of my own rentals because of this. With more rental properties hitting the market
  and prices continuing to fall
  , it seems things might get worse before they get better—at least for rental properties.
I hope you found this forecast helpful!  As always, feel free to reach out if you’d like to discuss your personal real estate situation . I’m here to help! And if you’re curious about how much YOUR home is worth, contact me today for a no-obligation home evaluation!