Hey Clients & Friends, 
Hope everyone had a fantastic June – We’ve got a lot to cover, so let’s dive in! 

This June marks the second month in a row that the Housing Price Index (HPI) went DOWN in Detached & Attached (Combination of Houses, Townhomes, and Condos, Duplex, Row) in the Fraser Valley, after 3 straight months of price increases. For sellers it was a very tough month having one of the lowest sales of any June in the last 19 years of recorded data but there’s still a lot more to run through below!
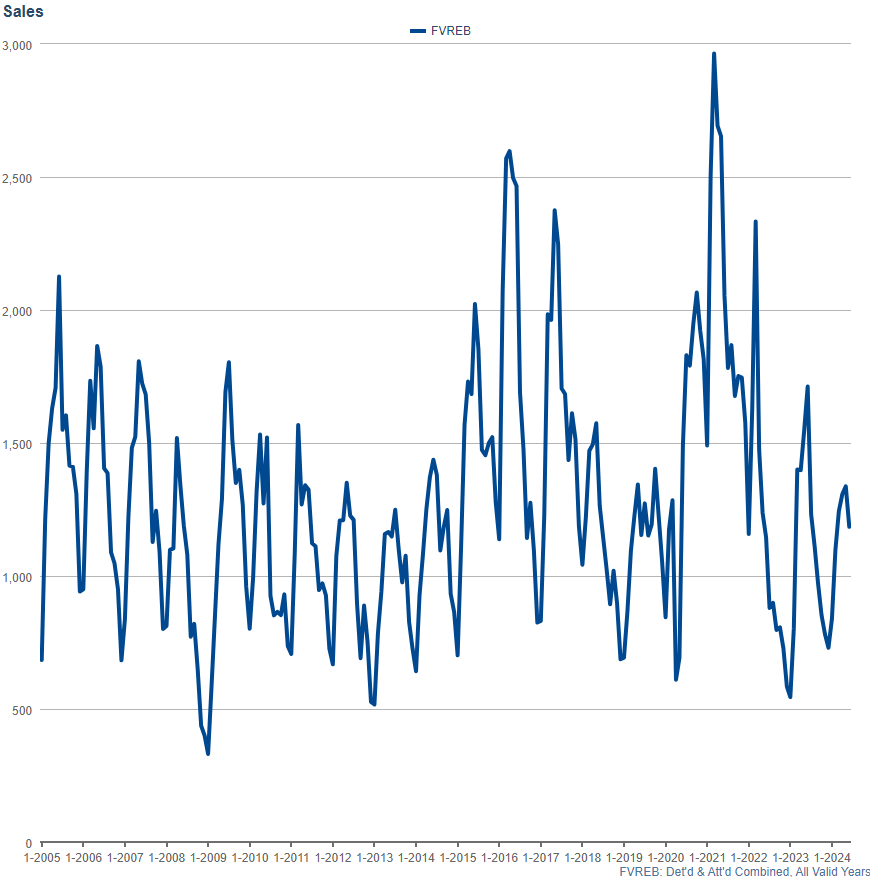
First of all, sales volume decreased substantially from May to June (1,337 down to 1,185 or -12%) which was not predicted after the Interest Rate cut we had (0.25% decrease). Instead of more buyers coming out from that announcement, we actually had far more sellers as you’ll see below. This is also not normally the trend over the past 19 years where most of the prior years we saw sales increase in June as opposed to fall. For those who have been following my updates you’ll remember my predictions earlier this year which unfortunately have come to pass.
What’s very important is how this June stacks up to the last 20 June’s, Stay tuned!
So, let’s explore the stats!
Home Prices
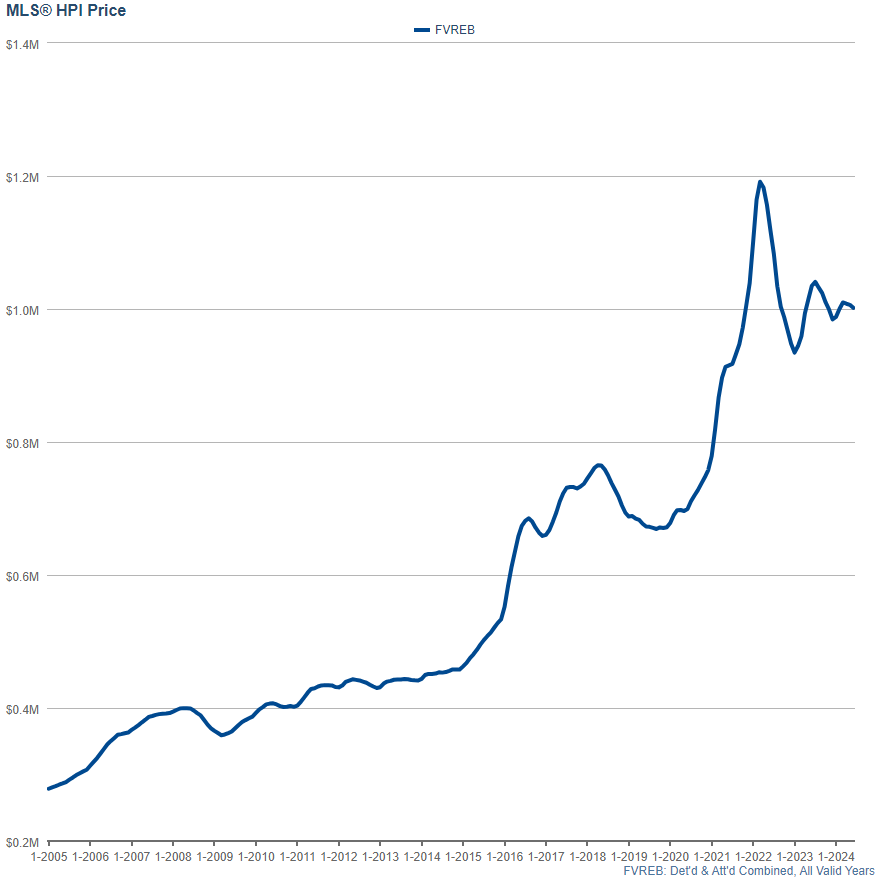
In the Fraser Valley, we’re marking the 2nd month of Housing Price Index decline in the Fraser Valley, (Combination of Detached Houses, Townhomes, and Condos) after 3 consecutive months of increases in home prices. This month all categories fell and the combined Detached & Attached decline was 0.5% (last month was a full 1% decrease). For sellers this continues to be worrying as many had hoped we’d continue to see prices increase after the interest rate decrease. Interesting to note however is that despite one of the biggest factor driving prices right now being the interest rates, prices have fallen roughly 80% of the previous 19 years between May and June (not that this is necessarily causal but interesting point of notice I had after some deeper analysis )
)
June 2024 -0.5%
May 2024 -1.0%
April 2024 +0.5% 
March 2024 +1.4%
February 2024: +0.9% (Previously documented erroneously as +3.7%)
January 2024 : -0.3%
December 2023 : -1.5%
November 2023: -1.1%
October 2023: -1.4%
September 2023: -0.9%
August 2023: -0.9%
July 2023: +0.5% (but started declining halfway through the month) 
 Sales Volume & Sales Ratio
While June saw prices decrease by half a percent overall, it also saw Sales Volume decrease (Detached & Attached Combined) from 1.337 sales in May to 1,185 in June. This marks a 12% decrease over May 2024 and ranks as the 3rd lowest June in the last 19 years of tracking. (With June 2022 and 2013 below slightly lower.) So definitely far lower than we’re used to seeing in recent history with the exception of 2022. You’ll also see below that Listings continued to surge, bringing sales ratios further down unfortunately.
Active Listings
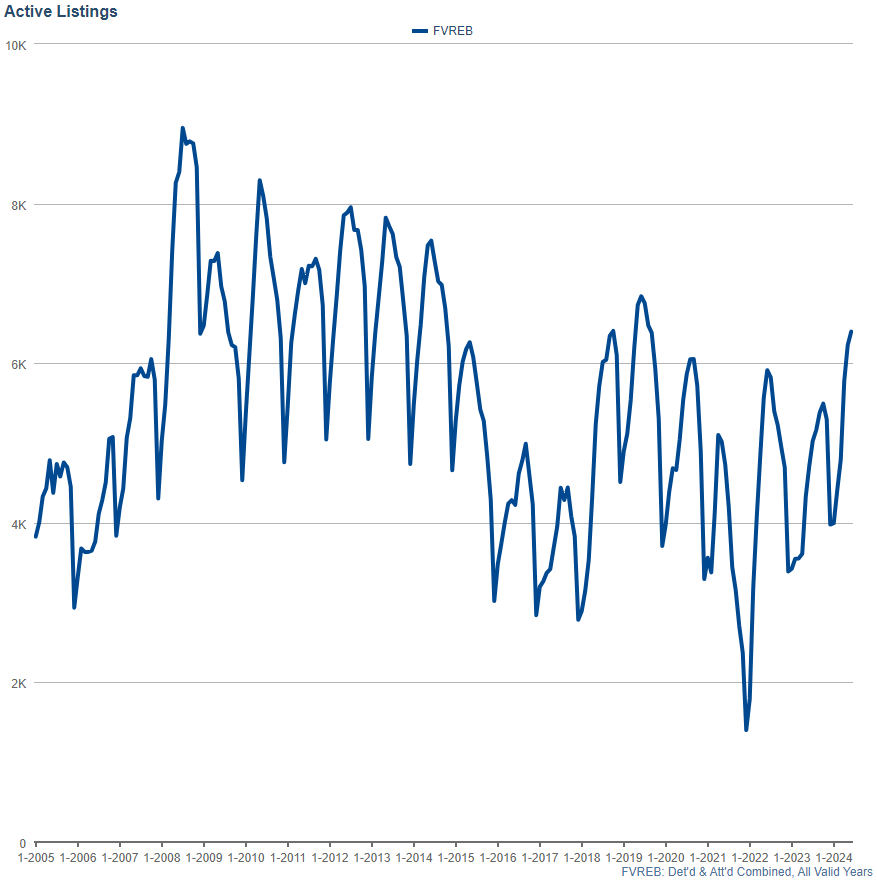
Inventory has continued to increase!  (specifically Detached and Attached Combined), with numbers rising from 6,229 in May 2024 to 6,383 in June, reflecting a 2.5% increase. This positions it as the 9th highest inventory June of the last 19 years on record, indicating a rather average level. For comparison, January ranked as the 12th highest January on record.
It’s challenging to discern significant trends from the modest uptick over the last 2 months; however, this trend has been accelerating recently, especially in areas heavy with rental properties experiencing very high inventory. I anticipate this trend will continue as more sellers recognize the declining sales ratios and list ahead of what they see as a softer market ahead. 
 Sales Ratios
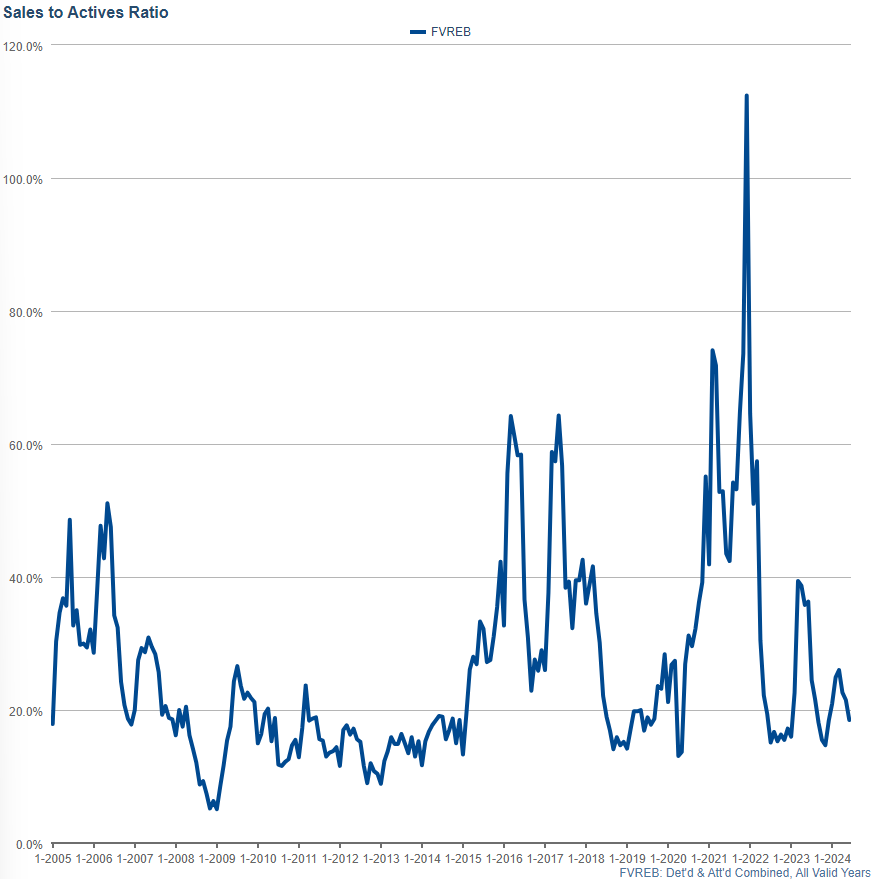
And then Sales Ratios (the number of listings that sell as a % of active listings in any given area) decreased again to an overall 21.5% from 18.5%. This is very much dependent on PRICE POINT, with sales ratios being favorable for sellers at the lower to mid-price ranges and almost non-existent in the luxury market. 

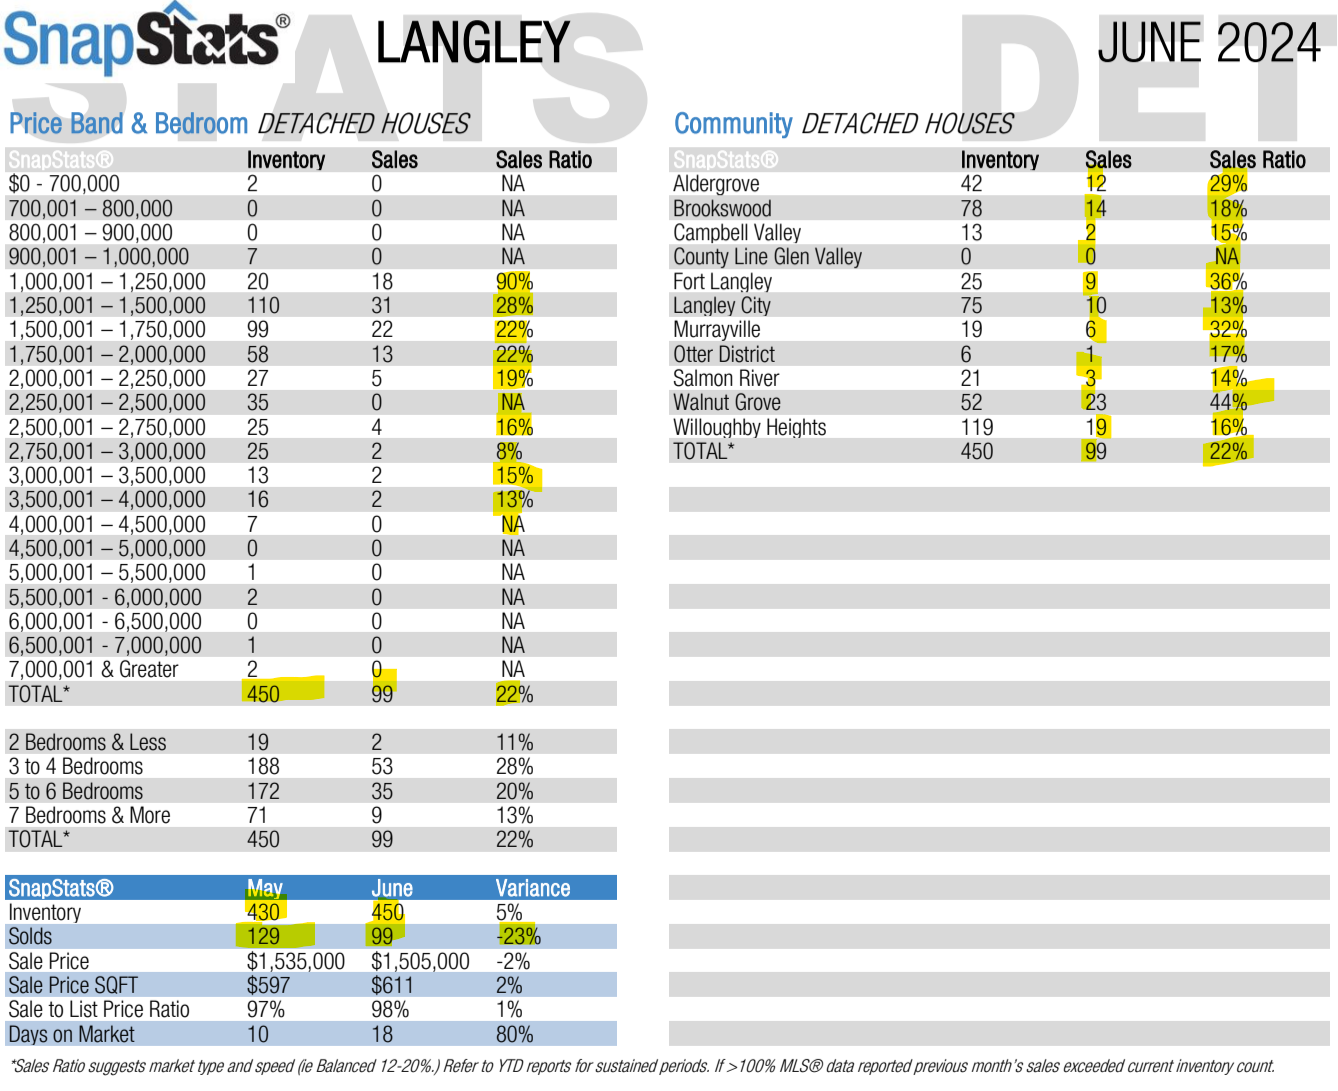
Langley Detached Houses:
Just like last month, we’re going to look at a couple of areas in the Fraser Valley, starting with Langley detached houses
In June, we saw a continuation of trends at an accelerating pace. More listings and fewer sales resulted in lower ratios everywhere, and the higher up in price you go, the worse the story is. 
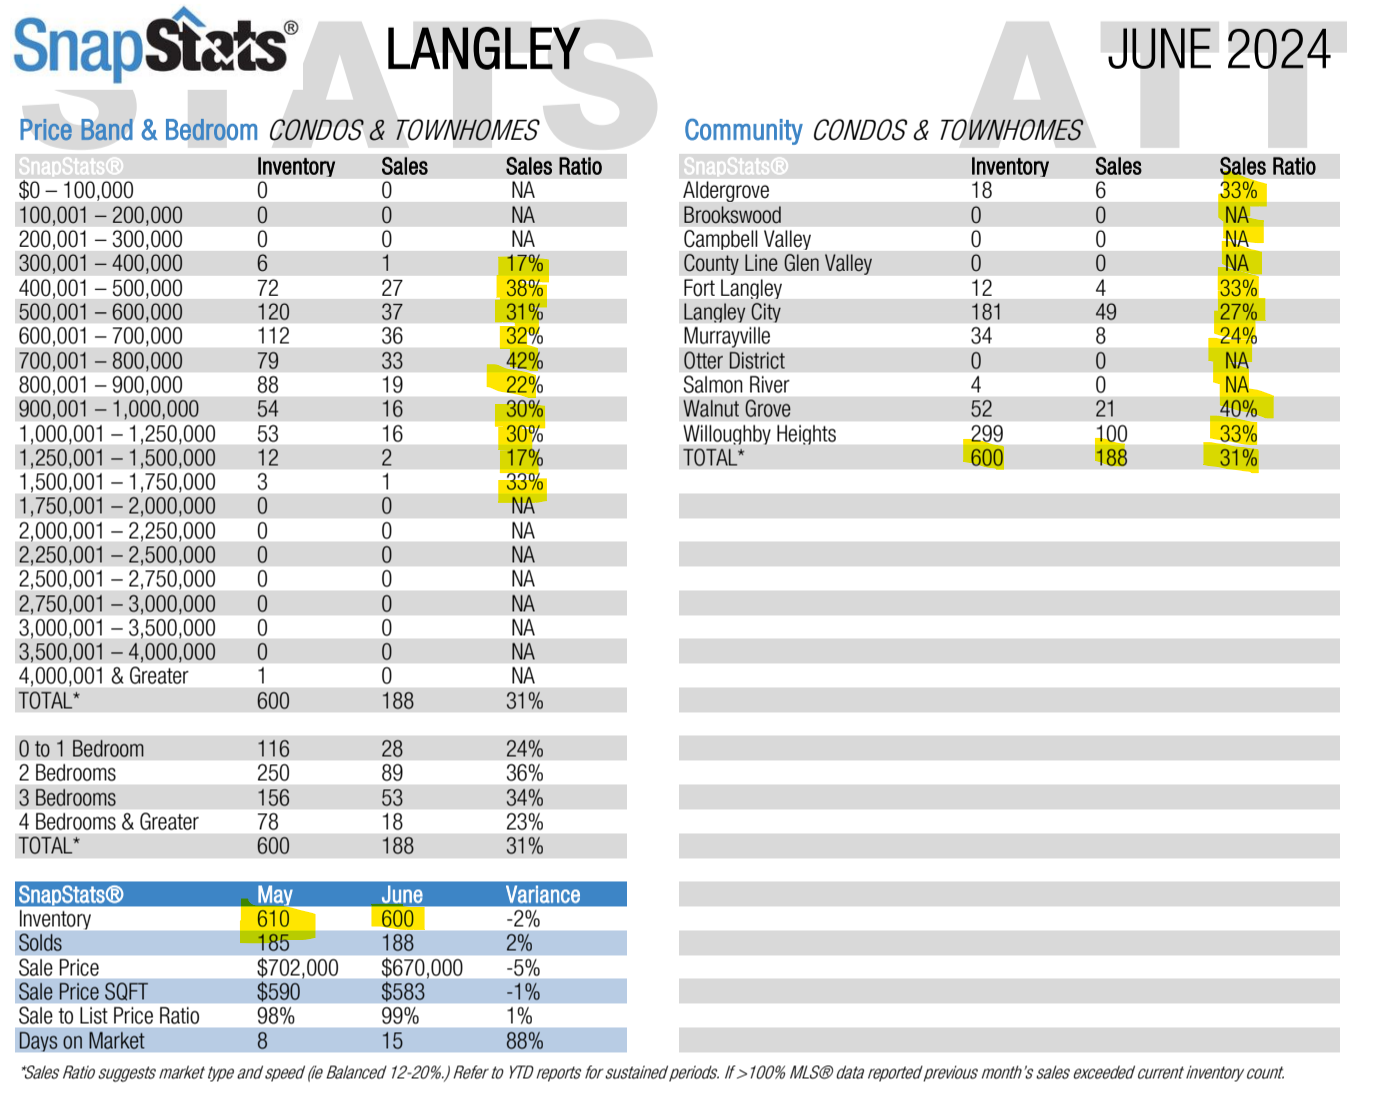
Condos and townhomes
Although everything is definitely on the decline, it hasn’t been as bad as detached homes or acreage. Sales ratios actually increased by 1% from May to June. While many areas still saw a decrease, many experienced an increase so overall sales went up 1%! 
Now, in the entire Fraser Valley, that’s not the case; however, this illustrates the point that condos and townhomes are faring much better than detached homes right now. 

 My Forecasting:
Here’s my quick (okay, not so quick lol) forecast:
A 0.25% cut on variable rates might bring more buyers off the fence, but as we’ve seen in June, even more sellers are jumping in. This flood of inventory will continue to likely drive prices down. 
Rental properties are so negatively cash-flowing that it’s unaffordable. On June 6th (the day of the rate reduction), I listed one of my rentals in Clayton Heights because, unfortunately, I was losing $3000-$3500/month due to the current high interest rates. It just didn’t make sense to keep it, as much as I wish I could! It was very bittersweet as I lived in that home myself for 8 years, but I digress lol!
June’s rate cut caused more sellers than buyers to enter the market. The rental market is brutal for landlords with current rates, leading to massive negative cash flows. As I mentioned above, I had to sell one of my rentals for this reason. With more rental properties hitting the market and prices falling, it looks like things may get worse before they get better.
I hope you found this helpful, and as always, please reach out if you’d like to chat about your own personal real estate situation. I’d love to help you out! 
And if you’re interested in how much YOUR home is worth, please reach out today for a no-obligation home evaluation!