Hey Friends and Clients! 
I hope you all had an amazing September! I know this can be a busy time of year for many, and it’s no different for our family! So, I’ll get straight to the point with this update and dive into the exciting new stats and insights I’m seeing in the market. There’s plenty to cover, so let’s get into it! 

September marks the sixth consecutive month where the Housing Price Index (HPI) for Detached & Attached properties (including Houses, Townhomes, Condos, Duplexes, and Rows) in the Fraser Valley has dropped, following earlier price gains. If you’re wondering how we went from the fourth month of decline in my last update to the sixth this month, it’s because the April stats were revised downward due to a market correction, marking six months straight of price decline. This trend continues to be challenging for sellers, with record low sales volume, just like in August. But there’s plenty more to discuss below! 
To start, sales volume dipped once again, this time from 942 in August to 873 in September (a -7% decline), which was disappointing for many sellers who had hoped the three consecutive 0.25% interest rate cuts would lead to more buyer activity 
 . However, the market has remained subdued despite the cuts, with near-record low sales volume since summer 2023. If you’ve been keeping up with my updates, you might remember that this was something I had predicted earlier in the year, and unfortunately, it’s continuing to play out.
What’s crucial now is how September measures up against the last 20 Septembers. Stay tuned! Let’s dive into the numbers! 
Home Prices
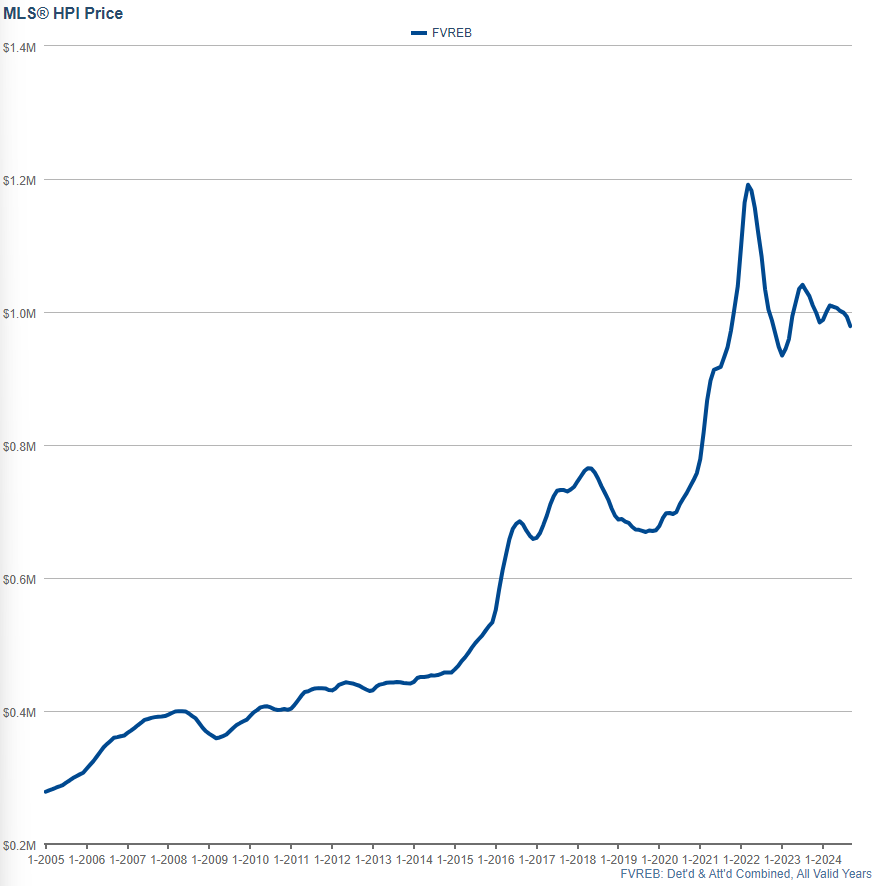
In the Fraser Valley, we’re now seeing the sixth month of decline in the Housing Price Index, covering all property types (Detached, Townhomes, and Condos), following a brief period of price gains earlier in the year. For sellers, this ongoing downward trend remains a concern, especially as many were optimistic that the recent interest rate cuts would help stabilize or even boost prices. However, an interesting point to consider is that, historically, prices have dropped in about 80% of the past 19 years during the summer months, particularly from June to August. While interest rates play a significant role, this seasonal trend has likely contributed to the current price declines. 
September 2024: -1.4% 
August 2024: -0.7%
July 2024: -0.3%
June 2024: -0.5%
May 2024: -1.0%
April 2024: -0.2% (This was revised from what it previously showed: +0.5%)
March 2024: +1.4% 
February 2024: +0.9% (Previously recorded incorrectly as +3.7%)
January 2024: -0.3%
December 2023: -1.5%
November 2023: -1.1%
October 2023: -1.4%
September 2023: -0.9%
August 2023: -0.9%
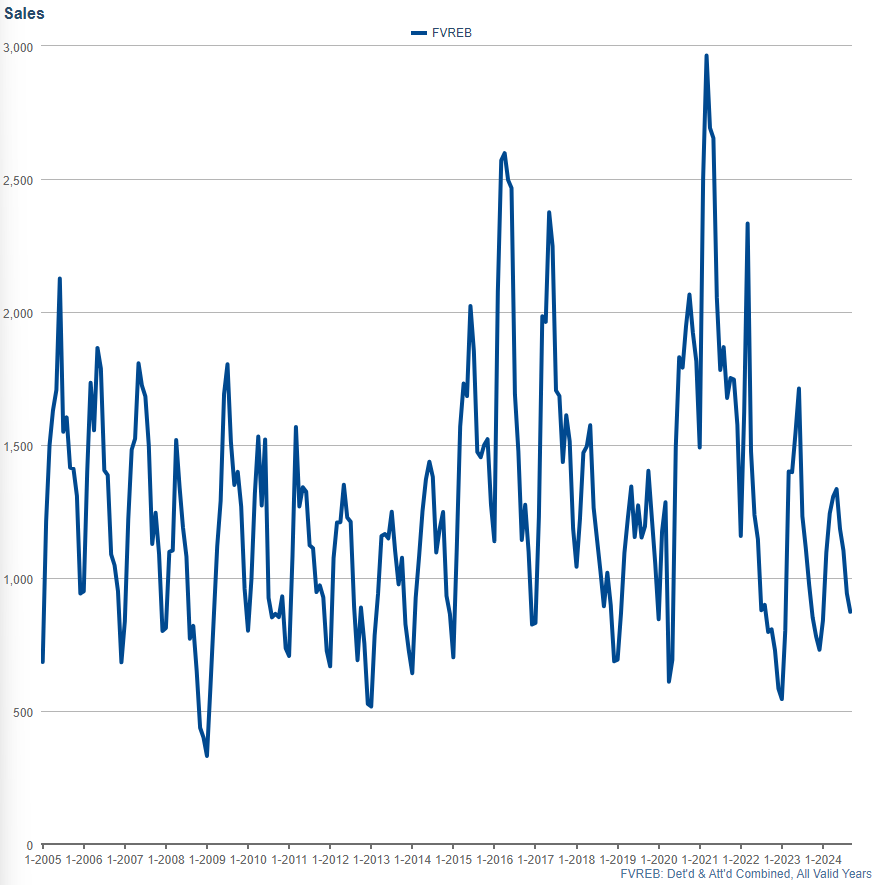
Sales Volume
September saw another dip in prices overall , as well as a continued decline in Sales Volume (for both Detached & Attached properties combined), dropping from 942 sales in August to 873 in September. This represents a 7.32% decrease from August and ranks as the 5th lowest September in the past 19 years of data tracking. For comparison, August was the 4th lowest and July was the 3rd lowest in their respective months. Although the trend seems to be improving slightly in relative terms, the sales volume remains lower than what we’ve typically seen in recent years. On a positive note, the number of new listings did drop slightly, offering some relief to current sellers .
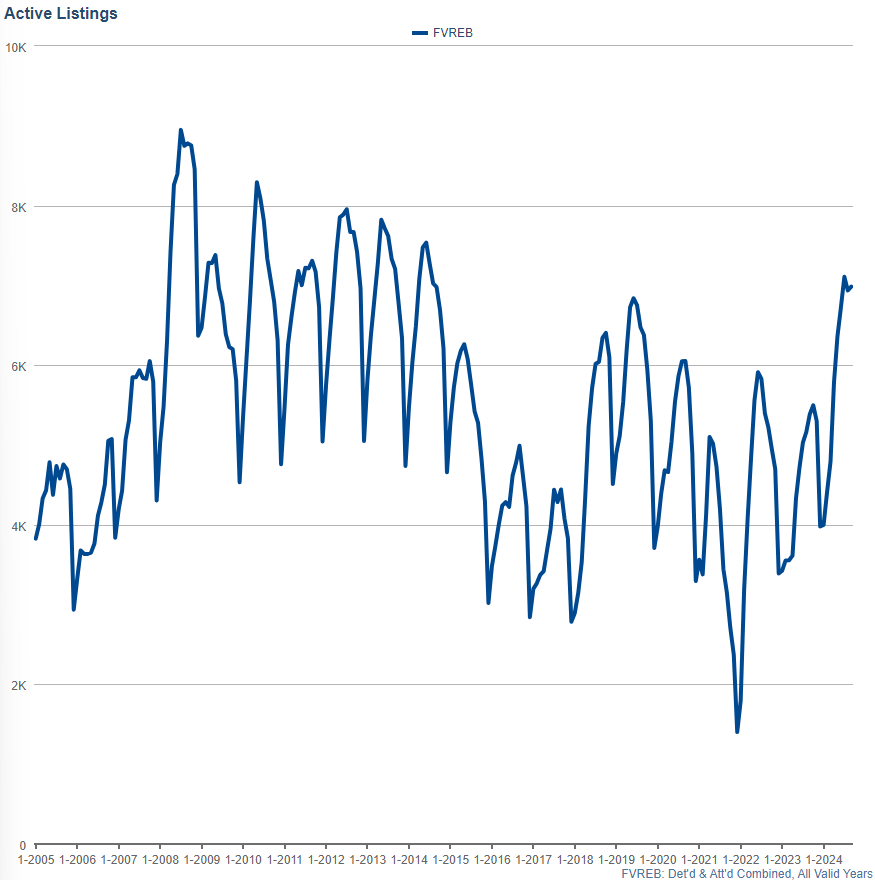
Active Listings
Inventory showed a slight increase in September, marking one of the few times we’ve seen a rise at this point in the year  . Active listings rose from 6,937 in August to 6,985 in September, representing a 0.69% increase. What’s particularly notable is that this year becomes only one of three times in the past 19 years where inventory has actually increased from September to October—the other years being 2023 and 2018.
To put this into perspective, 2018 was the year when the stress test, the foreign buyers’ tax, and around 20 additional regulatory changes were introduced into real estate law to cool the market, reducing buying power by as much as 20%. These weren’t exactly stellar years for sellers, and 2023’s trends have similarly created an interesting and unpredictable market. So while inventory trends have remained relatively modest over the past few months, this recent acceleration, especially in areas with high rental property inventory, is something to keep an eye on moving forward.
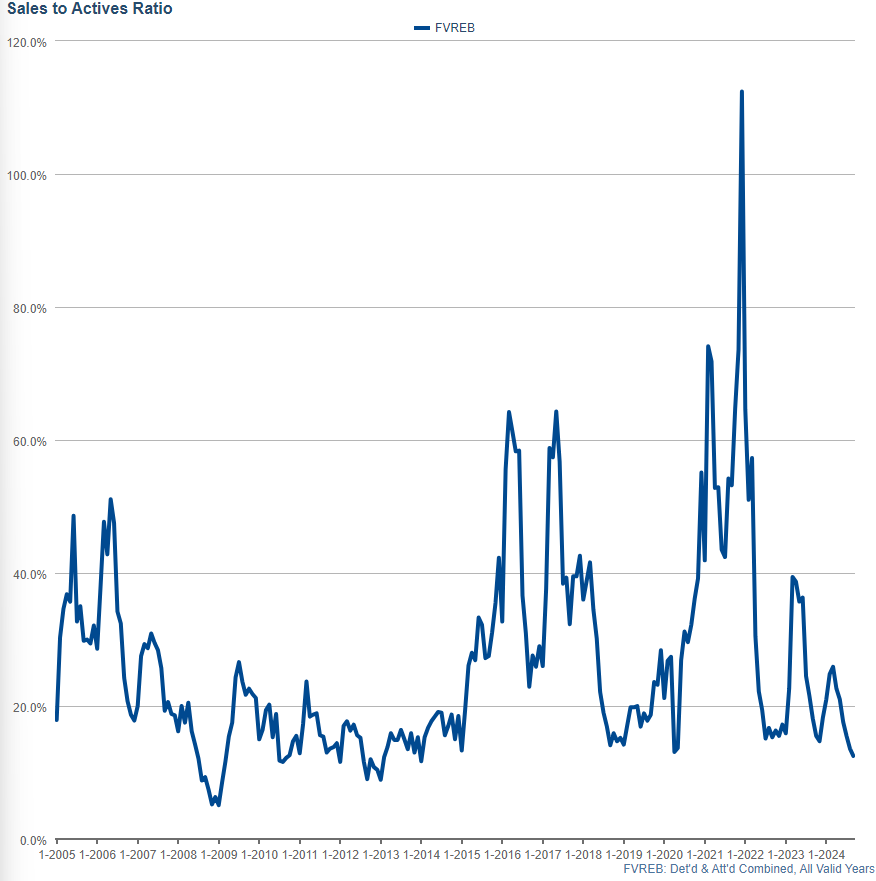
Sales Ratios
Sales ratios (the percentage of active listings that sell in any given area) have continued to decline, now sitting at 12.5% for September. Notably, August’s sales ratio was initially reported at 14.0%, but has since been adjusted down by the MLS to 13.6%. This ongoing decrease reflects a market where activity is much stronger in the lower to mid-price ranges, while the luxury segment remains particularly sluggish, with minimal buyer activity. 
 As always, price point plays a critical role in determining how quickly homes are selling, with more affordable properties still seeing relatively healthier demand compared to higher-end listings.
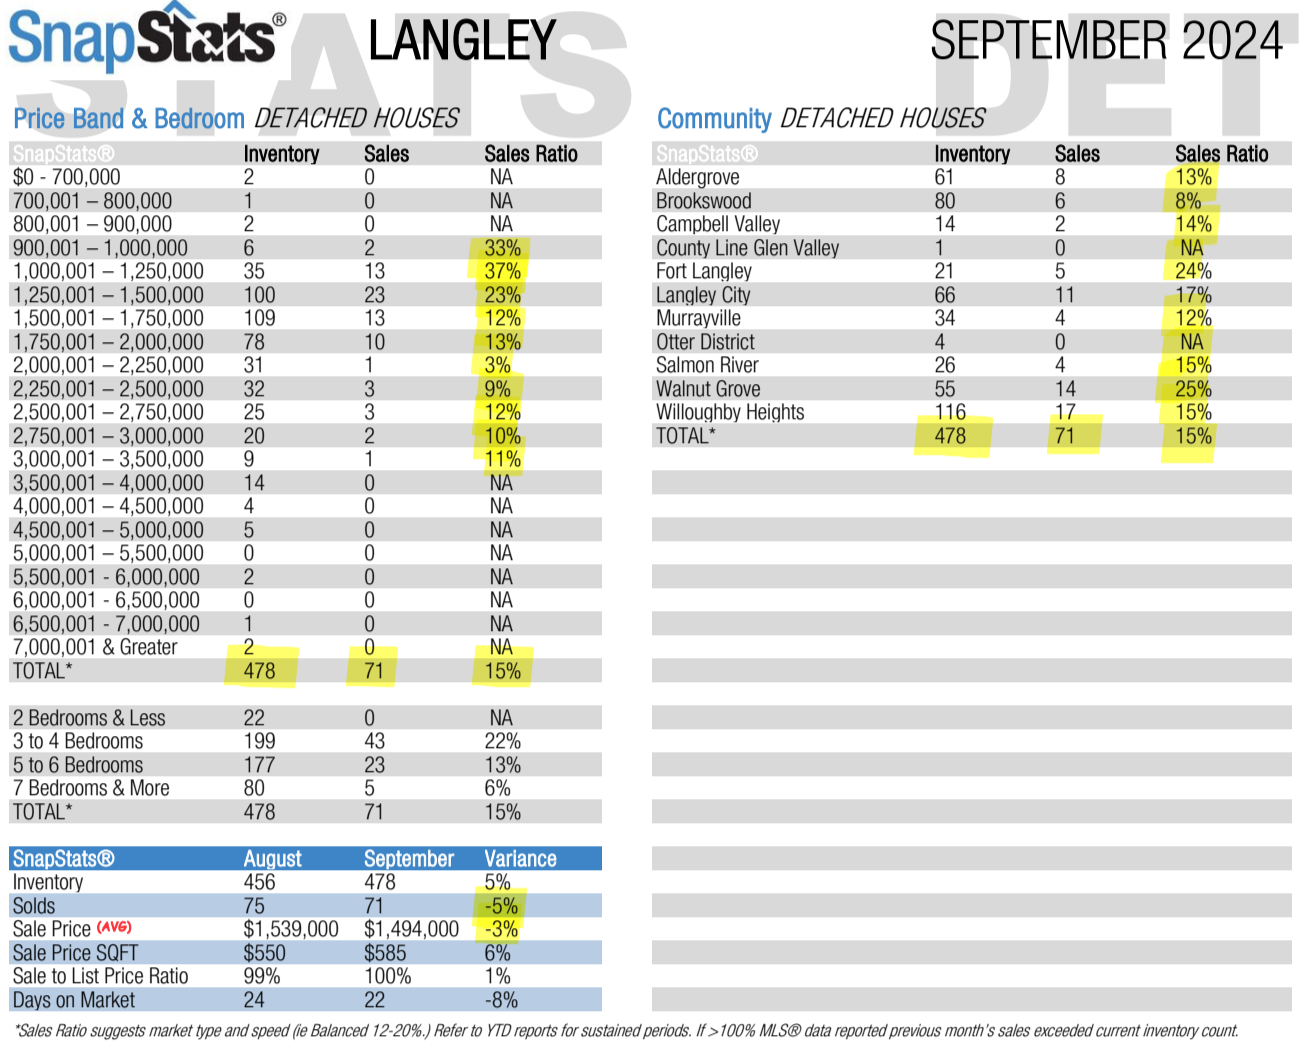
 Langley Detached Houses
Just like last month, we’re going to take a closer look at a couple of areas in the Fraser Valley, starting with Langley detached houses: 
In September, the trends worsened, with more listings hitting the market but even fewer sales, driving sales ratios down further. This decline has been more pronounced across the board, and the higher the price range, the more challenging the market has become. Sales ratios have dipped across nearly all segments, making it an increasingly tough market for sellers, particularly in the luxury sector. 
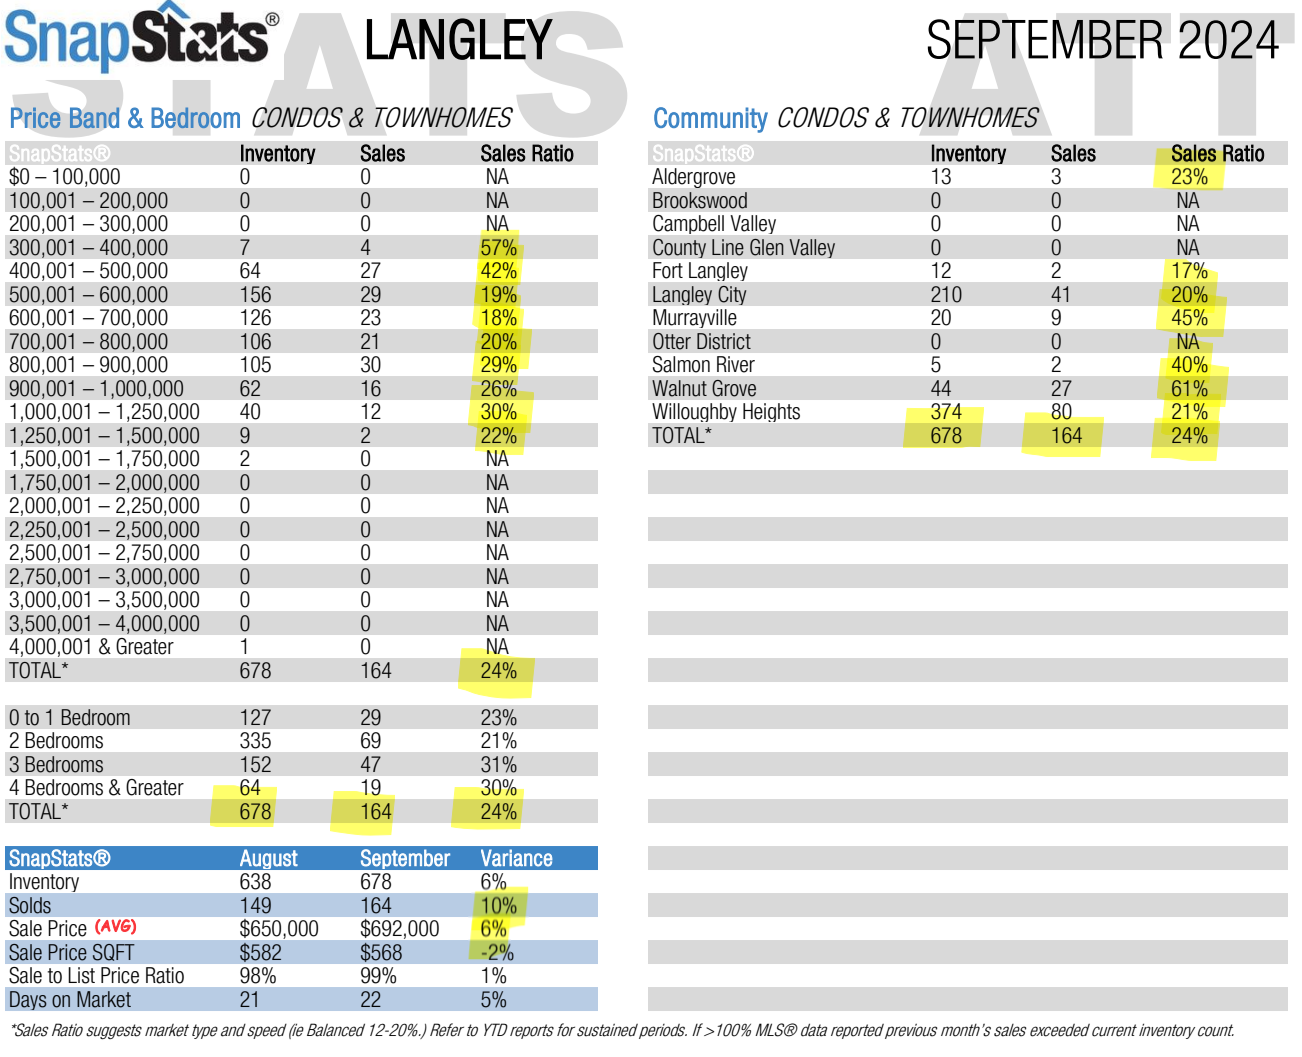
 Condos and Townhomes
For condos and townhomes, the story is a bit more positive, with many areas still showing a balanced market. While it’s not as challenging as it has been for higher-priced detached homes or acreages, sales ratios have still fallen slightly (stay tuned 2 pics down! ).
Interestingly, more condos were sold in Langley in September compared to August, which is a different trend from the Fraser Valley overall, where sales dropped by just over 10%. Despite the Housing Price Index (HPI) for condos falling by 0.3% in Langley and 0.4% in the Fraser Valley, the average sale prices are up 6%. This may seem counterintuitive, but with smaller sales volumes, the HPI is often a better indicator of market trends As it compares similar homes to themselves and how those valuations change accounting for variance in the actual type of home sold.
So that’s the Langley Condo and Townhome market, which wasn’t looking too bad… but now let’s take a look at the Overall Fraser Valley Condo Market for comparison. The condo market makes up a large portion of the strata market, and that’s what should concern you if you own a condo and are considering selling.
We’ve now officially hit a record-breaking number of condos listed in the Fraser Valley, with 2,210 active listings. On top of that, there’s another anomaly with the data. While last month initially showed a decrease in active listings, the charts have been updated to reflect a small increase for August. I’ve already reached out to StatsCenter for more information, but if the numbers we’re seeing now hold true, it could spell trouble for condo sellers in the months ahead.
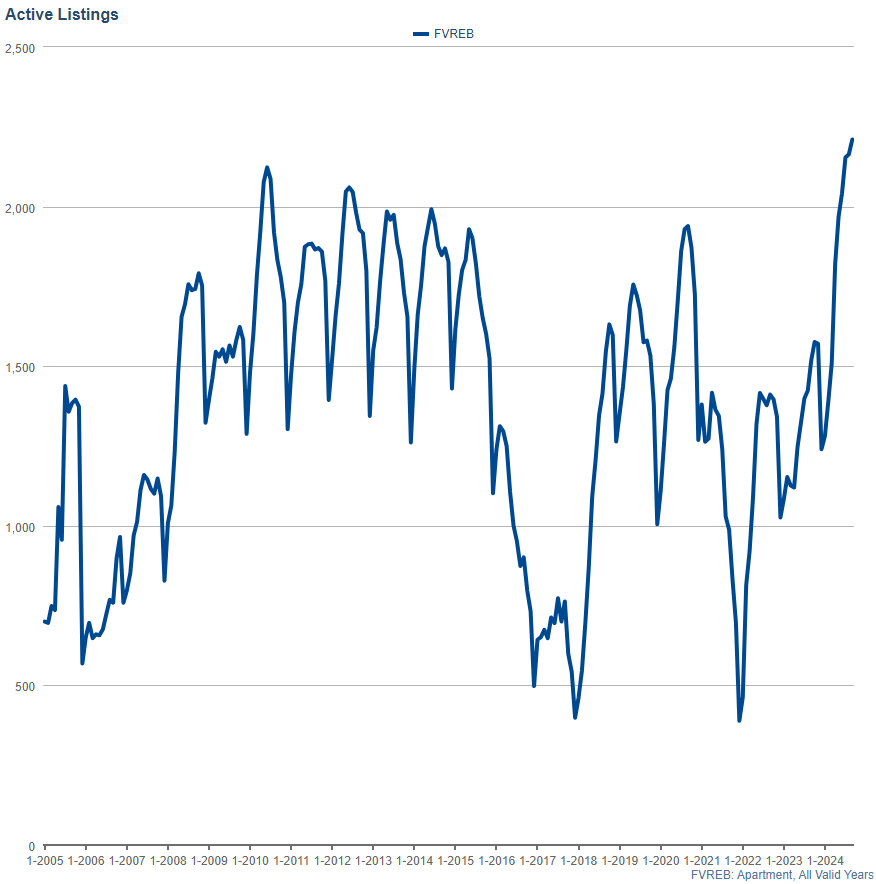
August 2024 was the highest August ever recorded in history for condo listings in the Fraser Valley. However, September 2024 not only surpassed that milestone by marking the highest September on record, but it also became the highest month ever recorded for condo inventory overall. This substantial increase signals a significant shift in the market, with inventory levels far exceeding anything we’ve seen before.
My Forecasting:
Here’s my quick (okay, not so quick!  ) outlook for October: Despite the three consecutive 0.25% rate cuts we’ve seen, as shared in my update above, the market continues to be flooded with more sellers than ever, particularly in the condo segment
  . Sale-to-active ratios have dipped into near-record lows, with luxury and high-priced properties in the low single digits for sales ratios. This influx of listings has continued to put downward pressure on prices .
Looking ahead, we have two major announcements from the Bank of Canada coming up—October 23rd and December 11th. Many top economists are forecasting another 0.25% rate cut at least once before the year ends, with more optimistic predictions suggesting a potential 0.5% to even 0.75% cut by December. Some of the more conservative economists are still betting on one more 0.25% cut. These forecasts have changed dramatically over the past few months as new economic data has shown just how precarious the situation is. In addition, we are closely following the U.S., which is cutting rates faster than initially predicted.
Now, on to rental properties—the market here is still challenging for investors. Until interest rates drop closer to 2.5% or at least 3%, we won’t see the average investor jumping back into purchasing resale condos. Currently, in BC, with rates around 2.5%, investors can at least break even, which has been the norm here in the province for years. But with rates remaining higher than that, cash flow on rental properties is still deeply negative , making it much less desirable to own or acquire rental properties  .
.
With more rentals hitting the market and prices continuing to soften  , we may see further downward trends before things stabilize.
I hope you found this forecast helpful!  As always, feel free to reach out if you’d like to discuss your personal real estate situation . I’m here to help! And if you’re curious about how much YOUR home is worth, contact me today for a no-obligation home evaluation!
-Cheers,