 Faces Escalating Trade Tensions Amid New U.S. Tariffs
Here’s What You Need to Know.
We’re already a week into March, and while last month’s discussions revolved around speculation, we’ve now entered the reality phase of the Trump Tariffs—where policy has turned into action, and Canada is responding in kind.
Tariffs & Their Impact on Canadian Real Estate – What’s Changed?
Last month, Trump’s tariffs were still being talked about as a negotiation tactic—and to be fair, they still could be. But now, we’ve officially seen the first wave of tariffs take effect, along with Canada’s counter-tariffs and a series of major announcements from both sides of the border.
This has only deepened economic instability, which is already having a major impact on the market.
Here’s a breakdown of what’s changed since last month:
The New Reality: U.S. Tariffs & Canada’s Response 25% tariffs on Canadian imports → In effect 10% on Canadian energy → Still in play 100% tariff on automobiles → Delayed but still looming Steel & manufacturing → Now confirmed, impacting supply chains Canada’s retaliation → $30B in counter-tariffs announced, with more to come
The biggest difference? It’s no longer just a threat—it’s happening.
What This Means for Real Estate Right Now Market Instability → Buyer Hesitation & Supply Chain Disruptions
 Higher import costs mean increased prices across multiple industries. Canadian manufacturers are already preparing for job losses and reduced output.
 Higher Consumer Prices → Bank of Canada Cuts Key Policy Rate Inflation concerns remain high, but in light of the ongoing economic strain, the Bank of Canada just made a 25 basis point cut to its key policy rate today, March 12, bringing the overnight rate to 2.75%, which is at the midpoint of its neutral range (2.25%–2.75%). While this move was widely expected, it’s unclear how much of an immediate impact it will have. We’re still a long way from seeing rental properties cash flow at 20% down payments, and it may take additional rate cuts before we see significant shifts in the market.
 Construction Costs Stay High → Housing Affordability Suffers
The cost of building isn’t dropping—if anything, these tariffs could drive it up further.
Will the Tariffs Stay or Will They Go?
Right now, there are three major schools of thought on what happens next:
 Some believe this is temporary and will disappear once Canada makes certain trade & policy concessions.
Others believe tariffs are here to stay for the long haul and will have long-term consequences.
Some blame Trump for the tariffs, while others argue Trudeau’s policies put Canada in a weak negotiating position to begin with.
Regardless of where you stand, the reality remains:
Uncertainty leads to hesitant buyers. Uncertainty leads to more sellers.
And that’s exactly what we’re seeing as we track market activity through February and early March.
If this whole thing gives you anxiety… same. Keep reading.
Check out my latest post on check out my latest post on Trudeau’s SECRET home equity TAX: 


February Highlights
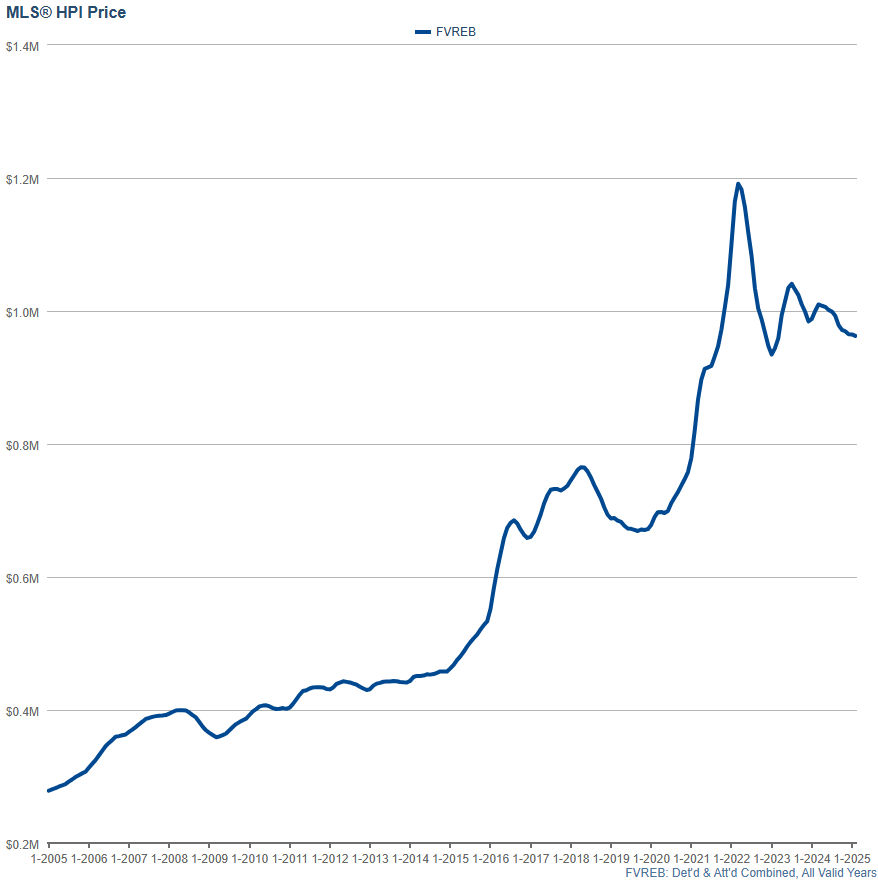
February marks the 11th consecutive month of decline in the Housing Price Index (HPI) for Detached and Attached properties, including Houses, Townhomes, Condos, Duplexes, and Row Homes in the Fraser Valley.
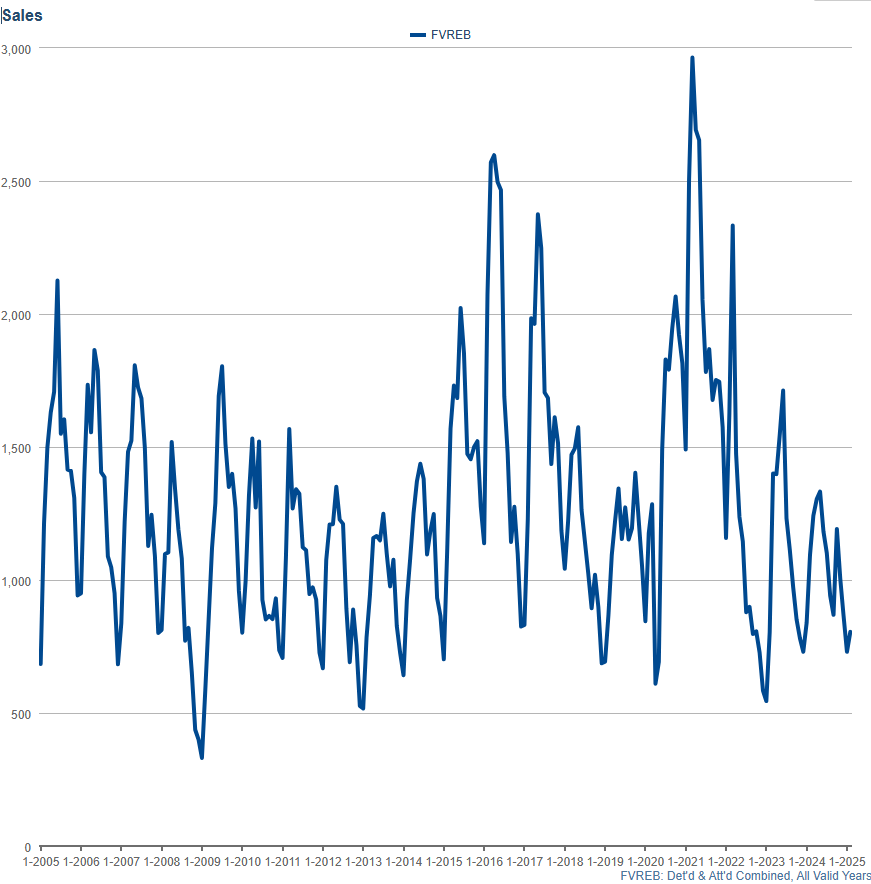
However, sales volume tells an interesting story—depending on how you look at it.
January saw 730 sales—near record lows. February saw a slight increase to 805 sales, but this still marks the slowest February we’ve seen since 2013—that’s 12 years since we’ve had a February this slow in the Fraser Valley.
Meanwhile, HPI fell slightly from $964,800 to $962,500—a 0.24% drop.
Home prices are currently sitting at October 2021 levels. But if we get another couple of months like February, we’ll be sitting at September 2021 prices before long.
Price Change Recap: 
- February 2025: -0.24%

- January 2025: -0.02%
- December 2024: -0.46%
- November 2024: -0.23%
- October 2024: -0.7%
- September 2024: -1.4%
- August 2024: -0.7%
- July 2024: -0.3%
- June 2024: -0.5%
- May 2024: -1.0%
- April 2024: -0.2% (revised from +0.5%)
- March 2024: +1.4%

- February 2024: +0.9% (previously recorded incorrectly as +3.7%)
- January 2024: -0.3%
- December 2023: -1.5%
- November 2023: -1.1%
- October 2023: -1.4%
Sales Volume
February 2025 was the 3rd slowest February in 20 years, with only 2009 and 2013 seeing fewer sales. It was also the 2nd slowest February since 2013.
While February is typically much busier than January, this year’s increase was minimal, with sales rising just 10.27% month-over-month from 730 in January to 805 in February—a small bump, but still well below historical norms.
To put things in perspective: February 2025: 3rd slowest February in 20 years January 2025: 10th slowest January in 20 years December 2024: 9th fastest December in 20 years November 2024: 9th slowest November in 20 years October 2024: 10th slowest October in 20 years September 2024: 5th slowest September in 19 years August 2024: 4th slowest August in 20 years July 2024: 3rd slowest July in 20 years
That’s not just a seasonal slowdown—that’s an increasing trend of uncertainty.
While this isn’t necessarily a sign of an outright crash, buyers are pulling back, and sellers are facing tougher conditions than they have in years. The market remains hesitant, and we’ll continue tracking these trends in the months ahead.
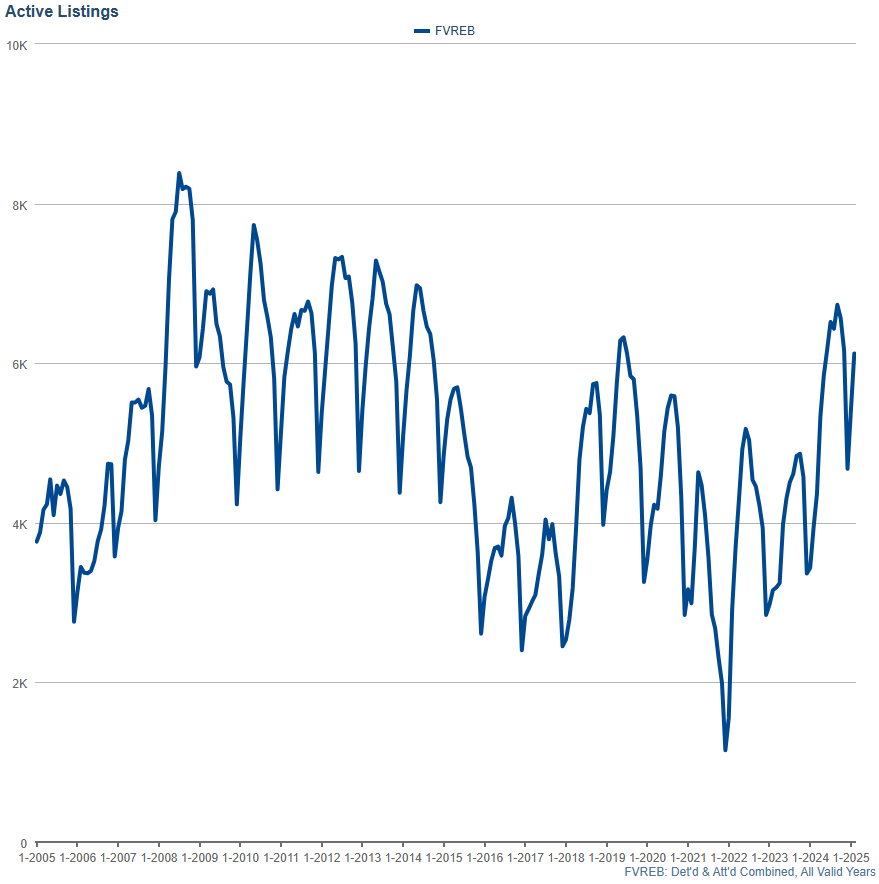
Active Listings
 Active listings climbed again in February, rising from 5,410 in January to 6,123—a significant jump as inventory continues to pile up.
With one of the slowest Februarys on record, it’s no surprise that inventory is surging, but here’s the real kicker:
This is the 2nd highest February for inventory in 20 years.
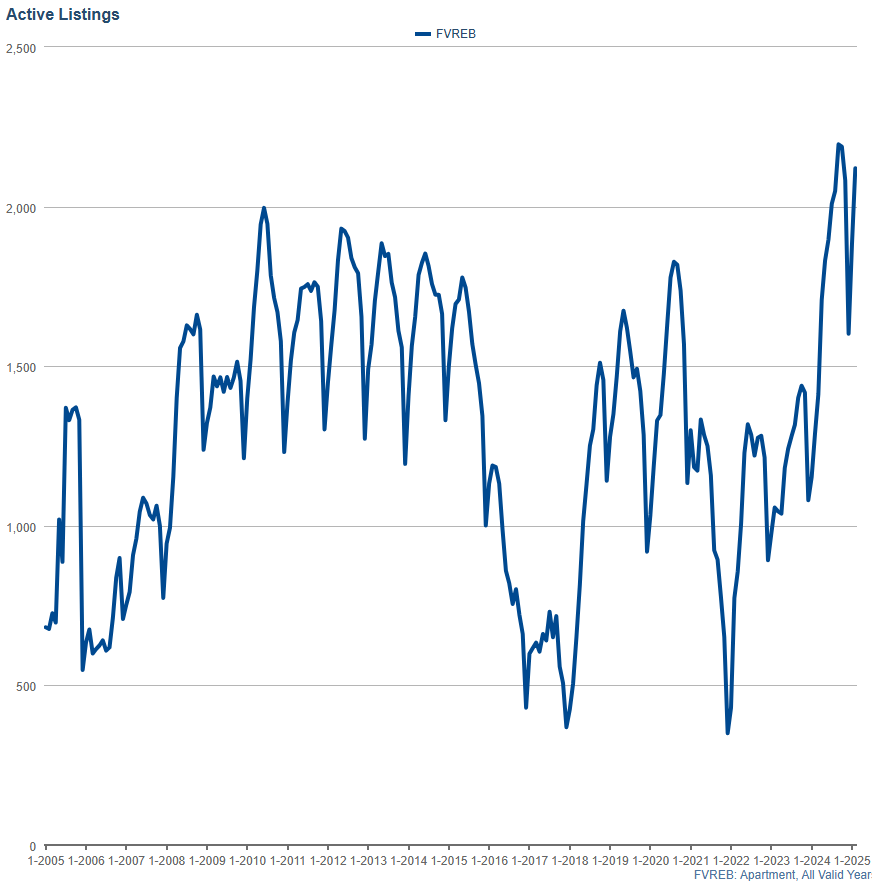
Condo Market – Inventory Surge Continues
 Condo inventory jumped from 1,881 in January to 2,120 in February. This is the highest February on record for condo listings. It’s also the 2nd highest month EVER recorded for condo inventory—regardless of the time of year.
For context, last month was already the 7th highest January for condo inventory.
Now, we’ve seen a sharp spike again in February—confirming a troubling trend for sellers.
Why Is Condo Inventory Surging?
A large portion of these units were bought by investors who planned to rent them out for profit. But now, they’re stuck because: Sales volume is down Valuations have dropped 15-20% Negative cash flow is stacking up Interest rates remain high, especially for pre-construction units
This creates a perfect storm where many investors can’t afford to sell at market value, but they also can’t sustain the financial losses much longer.
Unless interest rates drop significantly or valuations stabilize, this imbalance is likely to continue.
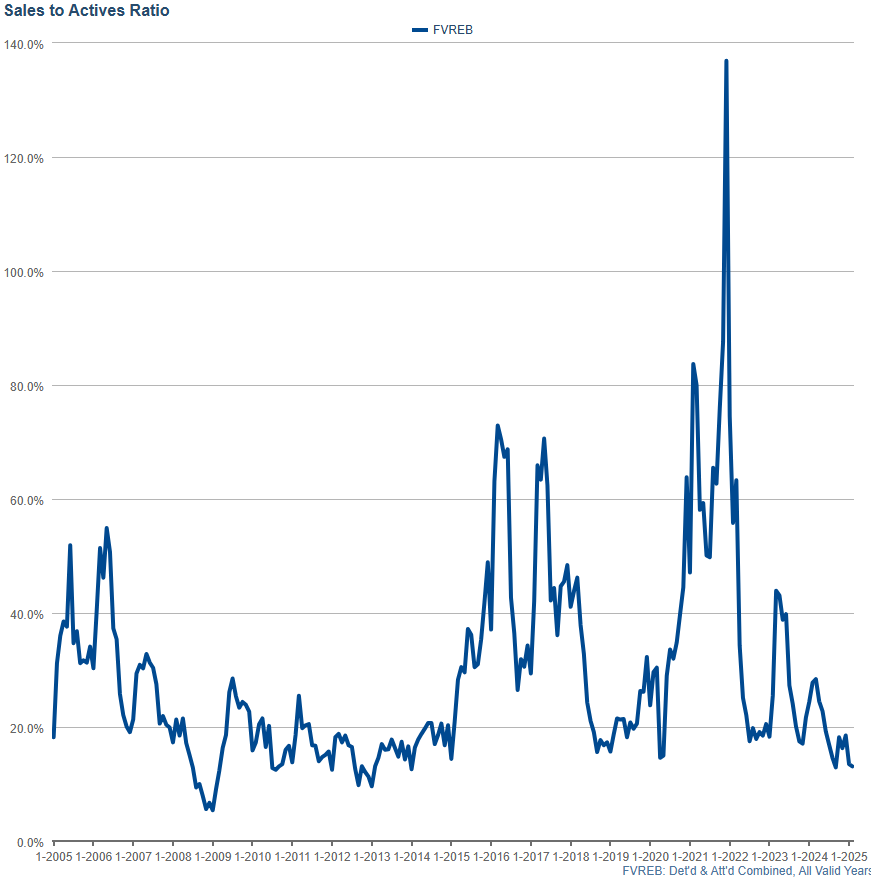
Sales Ratios 
Sales ratios—a key measure of market activity—declined even further in February, reflecting continued softening demand across most property types.
Overall sales ratio fell from 13.5% in January to 13.1% in February. This puts February 2025 in a dead tie with 2013 as the second lowest February on record, only behind 2009.
What This Means for the Market
 We are now firmly in a buyer’s market. Condos continue to struggle as demand remains weak across multiple price points. Lower-to-mid price ranges still see some movement, while luxury properties remain slow. Buyers have more options than ever, while sellers are facing increased competition and longer days on market.
Sales ratios provide one of the clearest real-time indicators of market sentiment. With numbers like this, it’s clear that uncertainty is weighing heavily on buyers—and sellers need to be strategic in this shifting market.
The Bank of Canada’s rate announcement on Wednesday, March 12, 2025 has now come and gone, and it’s already shaping up to be a pivotal moment for the real estate market.
The Bank of Canada cut its key policy rate by 0.25%, bringing the overnight rate to 2.75%, which is at the midpoint of the neutral range. This move was widely anticipated and directly impacts variable-rate mortgages, home equity lines of credit (HELOCs), and other loans.
But that’s not all—bond yields have been falling as Canadians flock to bonds for security, pushing fixed mortgage rates to their lowest levels this year.
Could Interest Rate Cuts Stop Prices from Falling?
 The Bullish Case: Some experts believe that continued rate cuts through July (potentially another 1% total) could stabilize prices and even spark a rebound, especially if inflation remains under control.
The Bearish Case: Others argue that even aggressive rate cuts won’t be enough to counteract Canada’s economic uncertainty and weak fundamentals.Meanwhile, the Trump tariffs and trade war are fuelling uncertainty, and many feel the government will step in to prevent home prices from collapsing further. Why? Because Canadian real estate is deeply tied to retirement funds, pensions, and hedge funds. If prices drop too far, it could mean widespread financial fallout, forcing the government’s hand to protect real estate values—just as they’ve done in the past.
So, What’s MY Outlook?
Do I think interest rate cuts will suddenly reverse the market? No.
Do I think they will stop prices from free-falling? Probably.
Do I think we could start seeing stabilization and even some appreciation? Yes—but it will take time.
Remember: We’ve now had 11 straight months of price declines, and February was one of the worst Februarys in 20 years. Even if the market starts turning, we have a long way to go before we’re back in strong territory.
I hope you found this forecast helpful!  As always, feel free to reach out if you’d like to discuss your personal real estate situation
  . I’m here to help! And if you’re curious about how much YOUR home is worth, contact me today for a no-obligation home evaluation!
