Hey Clients & Friends, 
Hope everyone had a fantastic April – We’ve got a lot to cover, so let’s dive in! 

 . But first, some more news to report on Sales Volume: it went up as expected, however, inventory went up even more, bringing down sales ratios. What’s important is how this April stacks up to the last 20 April’s! Stay tuned!
…So, let’s dive into the stats!
Home Prices
In the Fraser Valley, we’re marking the 3rd month of Housing Price Index increase, after 7 consecutive months of decline in home prices! While last month we saw condos slightly appreciate (0.3%) this month we saw all categories increase. For sellers this is signaling a potentially brighter outlook for prices compared to the recent trend but many buyers are worried they missed the bottom:


March 2024 +1.4%

February 2024: +0.9%
 (Previously documented erroneously as +3.7%)
January 2024 : -0.3%

December 2023 : -1.5%

November 2023: -1.1%

October 2023: -1.4%

September 2023: -0.9%

August 2023: -0.9%

July 2023: +0.5% (but started declining halfway through the month)


Sales Volume & Sales Ratio:
 , it also saw Sales Volume increase (Detached & Attached Combined) slightly from 1,244 sales in March to 1,310 in April. This marks just a 5 % INCREASE over March 2024 and ranks as the 12th highest April in the last 19 years of tracking. So definitely far lower than we’re used to seeing in recent history with the exception of last year. You’ll also see below that Listings went up more, actually bringing sales ratios down unfortunately.


 (The number of listings that sell as a % of active listings in any given area) actually decreased to an overall 23.8% from 26.6.8%.
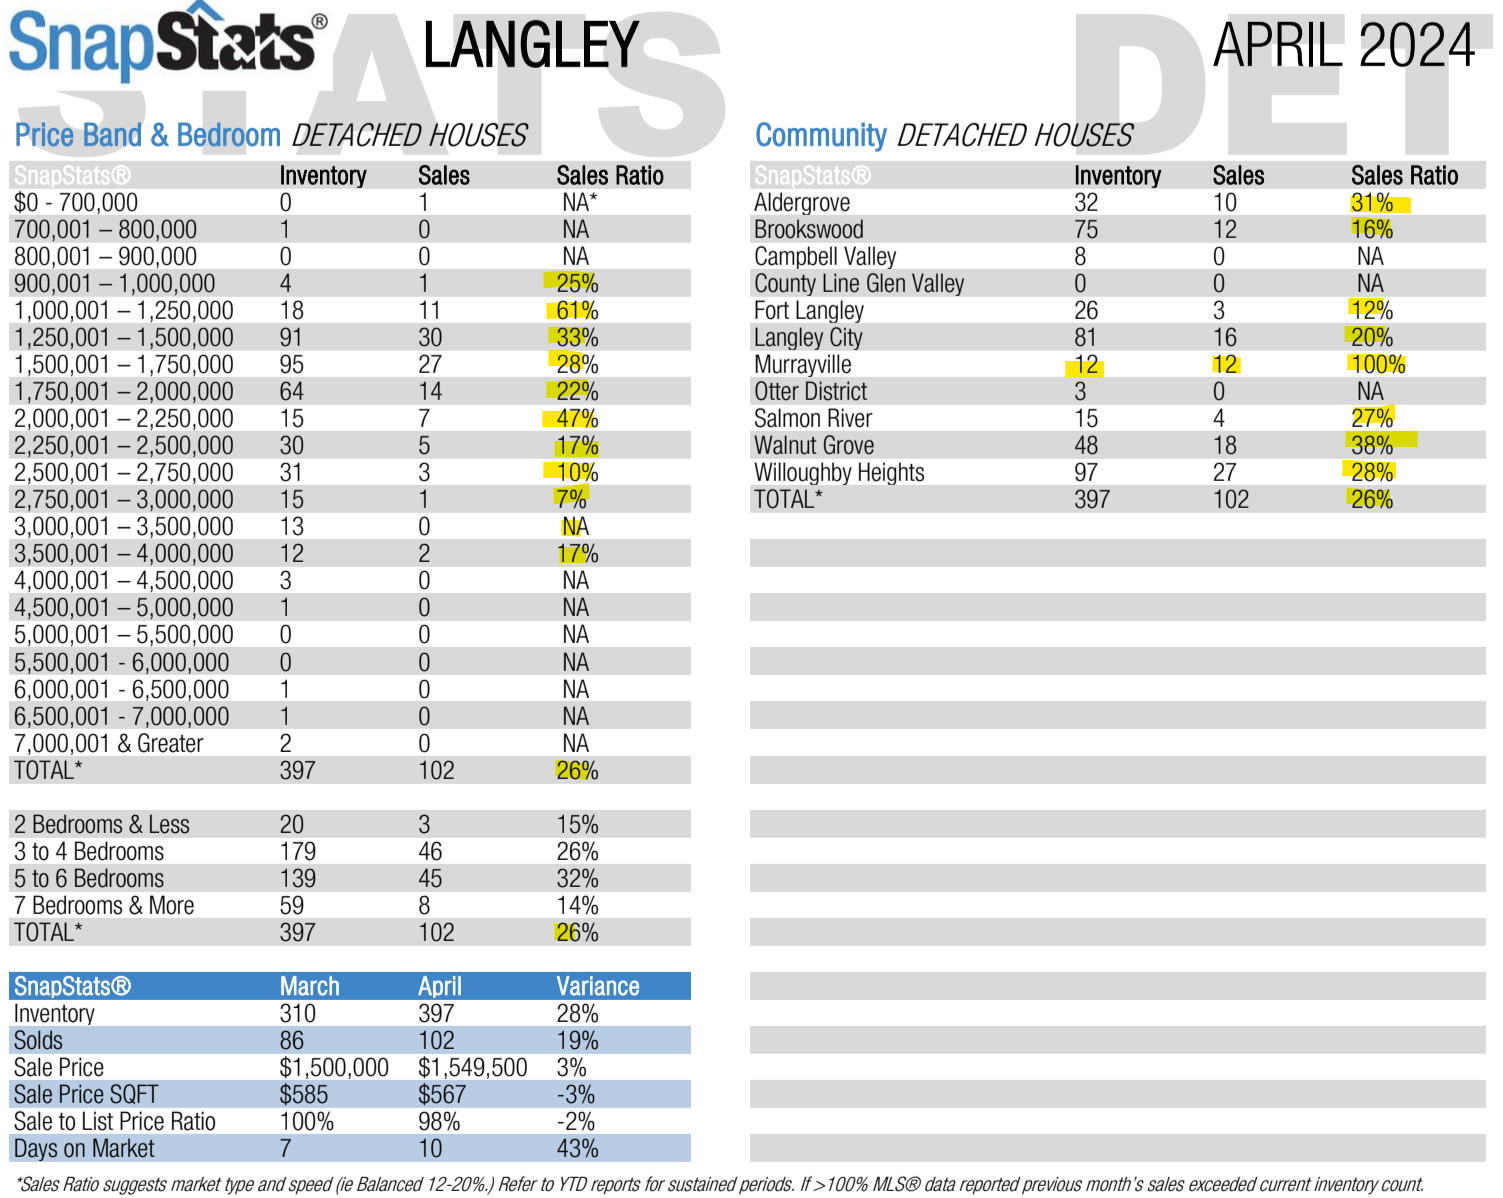
 (which is very much dependent on PRICE POINT with the sales ratios being favorable for sellers at the lower to mid price ranges and then almost non-existent in the luxury market).


 Keep in mind this is not meaning prices themselves have gone up 3% in just a month but that just the average sale price moved up that much higher. This is somewhat interesting for anyone with a more expensive home as they can now expect to sell it but they must be competitive with the other homes on the market as the ratios are still extremely low.


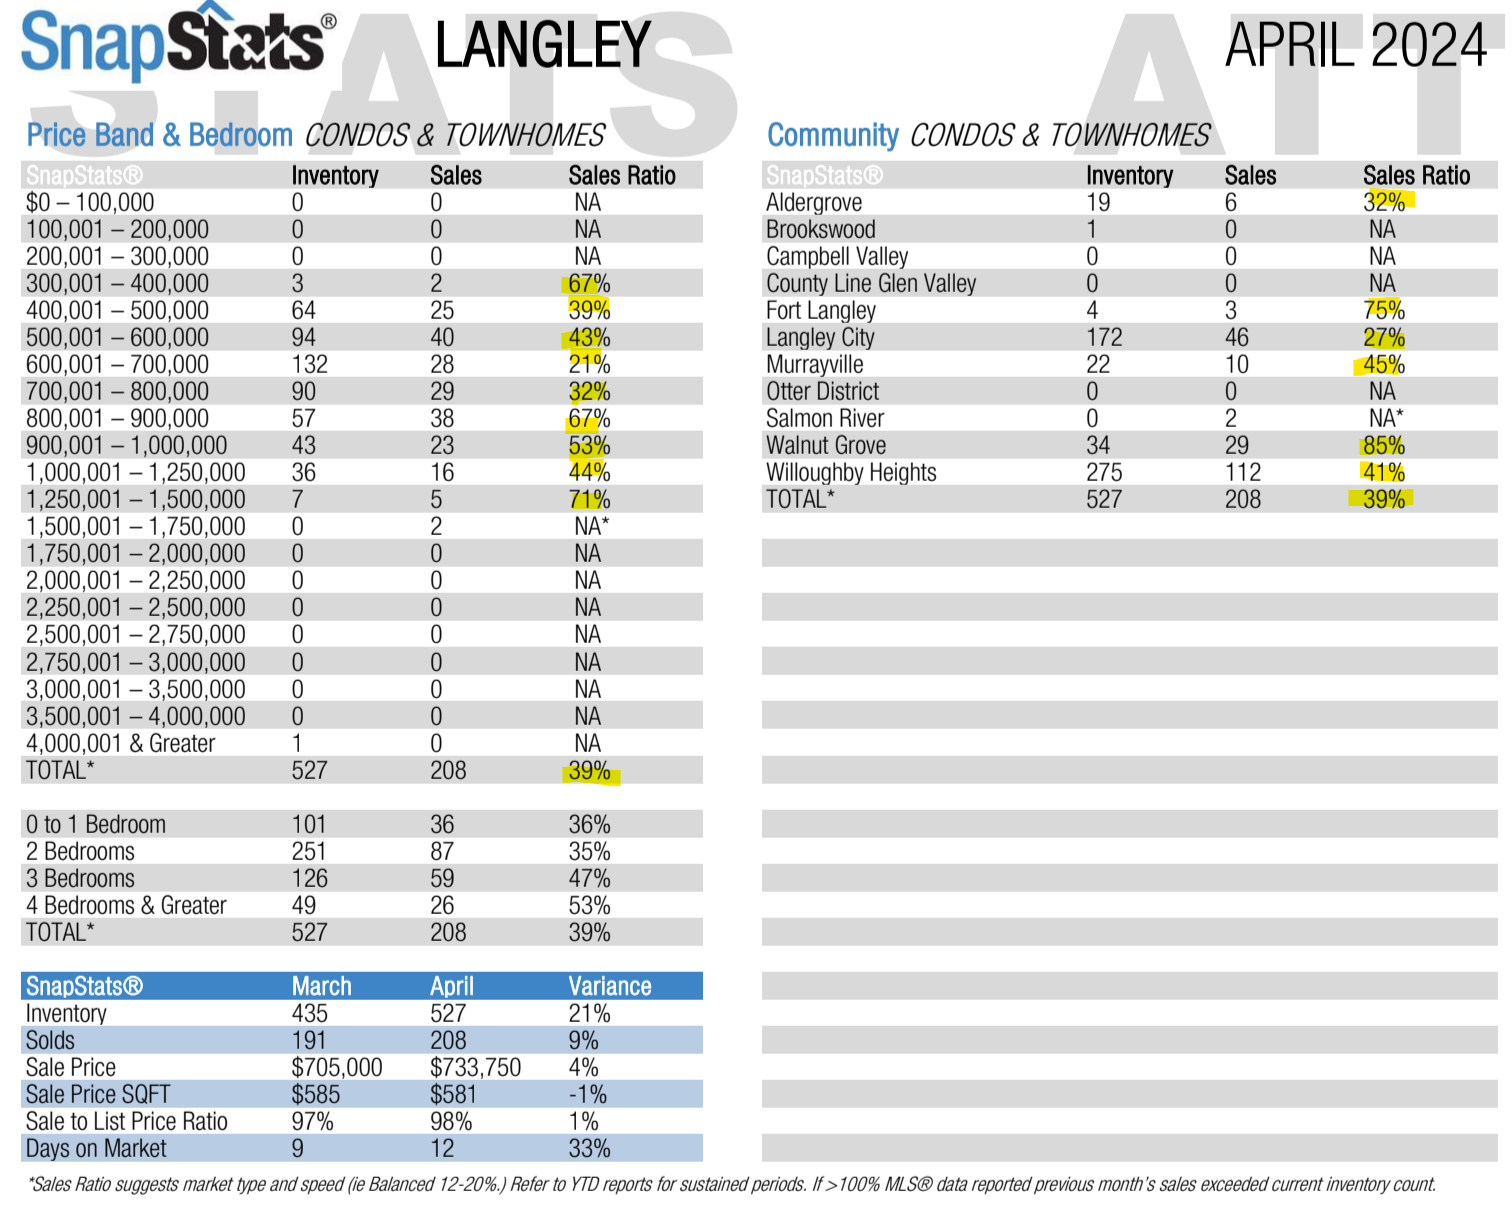
 Sales ratios have only dropped slightly (41% to 39%) which haven’t been seen since Spring 2023 (before the last two interest rate increases!)…and we’re still just starting to see this number fall slightly. Some price points have sales ratios as high as 68% and some areas of Langley are 85% sales ratio across all Condos / Townhomes such as Walnut Grove!
  (Taking out low volume prices/areas).
Finally, let’s take a look at the available Inventory!
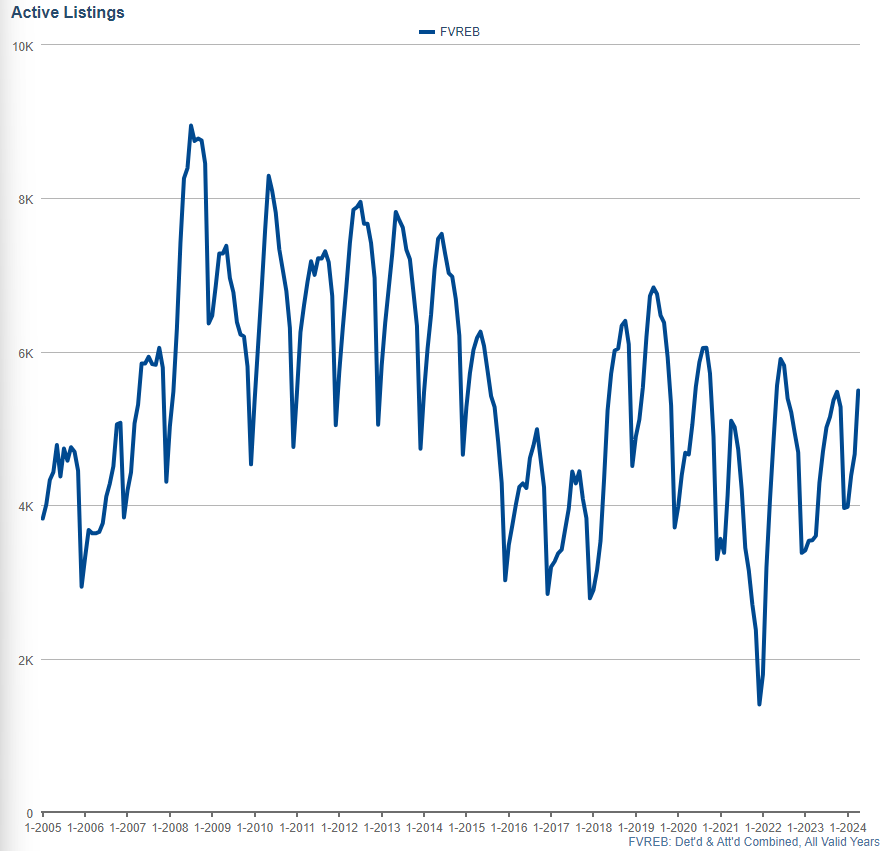
Active Listings: While we saw somewhat promising developments in pricing, we’ve seen sales ratios drop and therefore as you would expect, inventory has started to increase substantially! (specifically Detached and Attached Combined), with numbers rising from 4,666 in March 2024 to 5,494 in April, reflecting a 17% increase. This positions it as the 9th highest inventory April of the last 19 years on record, indicating a rather average level. (Back in January for comparison we also ranked as the 12th highest January on record

My Forecasting:
 )
)In January, many top economists were still expecting 4-6 rate cuts for the year and expecting the first one to be between June and July…but this month, things have shifted! Many economists and those in the forward-hedging markets are now predicting as low as 1 to 2 rate cuts which is much less than many Canadians have been expecting and preparing for.
 Canada 5-Year Bond Yield – Investing.com
This section remains the same as last month, FYI: With interest rates as high as they are, and likely to remain higher for longer, rental properties have become dramatically different to own. Someone who purchased a home at 3% interest rates might have had the rent cover all the expenses of the house, referred to as “breaking even,” OR may have potentially had some positive cash flow if the home had a secondary suite or the like. The difference is NOW, that same rental property (at 5% to 7% interest) may be negative cash flowing anywhere from $500 to $4,000 a MONTH! This is becoming more and more untenable and will continue to lead to more rental properties having to be sold due to not being able to afford that much per month.
In BC, nearly a quarter of all homes are owned by investors. 1/3 of all condos are investor-owned. This is more than any other province, so this could have a major impact.
I’m personally quite persuaded by the rationale that the BoC is going to wait until GDP slows down further than it is now, and also wait for inflation to stabilize closer to 3% before it starts to decrease rates. I still think it could very likely be around the June/July announcement dates, which would dramatically shift the market sentiment and very likely increase prices. If interest rates remain unchanged for now, then we might see prices continue to increase slowly or very likely fall if we see large amounts of inventory finally hit the market for the reasons above. This could stagnate the market again in terms of sales too!
Also, If we start to see listings come to market faster than expected, this could drive prices lower again even despite an interest rate cut. It’s hard to know but it will very much be based on when interest rates start coming down and by how much!
I hope you found this helpful, and as always, please reach out if you’d like to chat about your own Personal Real Estate Situation, and I’d love to help you out!
And if you’re interested in how much YOUR Home is worth – Please Reach out today for a No Obligation Home Evaluation!
Cheers!
 UP
UP DOWN
DOWN


