 ?
?Hey Friends and Clients!
I hope you all had an amazing Christmas, New Year, and holiday season!
January is starting off strong with a rush of inventory hitting the market and higher sales volume in the first two weeks compared to the last two weeks of December. While interim numbers are difficult to measure fully, it will be interesting to see how the rest of the month unfolds.
As I mentioned last month, some significant mortgage rule changes took effect on December 15th:
- The Federal Government increased the insured mortgage limit from $1 million to $1.5 million.
- Down payment qualifications were reduced by over 50%. For example, a $1.5 million home now requires only a $125K down payment instead of the previous $300K.
- Amortization periods were extended from 25 years to 30 years, offering either a 12% payment reduction or an increased buying power of 12%.
For a complete list of these new down payment rule changes, check out my video here: https://youtube.com/shorts/k6KPaEgGinU?si=bM7iVEvoyqBX7COk
The hope is that this demand-side legislation will help stabilize and potentially recover prices after a seven-month decline. By enabling buyers to put down significantly less and spread their mortgage payments over a longer period, homes between $1 million and $1.5 million will likely see the most impact. However, as the saying goes, a rising tide lifts all ships.
Let’s see how this plays out in the coming months!
***SKIP BELOW IF YOU WANT TO GO RIGHT TO THE STATS OR STICK AROUND FOR A FEW EXTRAS !
Viral Post of The Month: 

When did being a landlord go from a noble pursuit to a dirty word?
It wasn’t long ago that owning property was seen as the ultimate path to building wealth. The idea was simple: take some risks, save up, buy a property, and profit while providing someone with a home.
I remember back in high school when condos were selling for $100,000. It was explained to me that if I could save $7,000–$8,000, I could own a home. If I saved a bit more—maybe $20,000–$30,000—I could invest in another property. It was a secure, long-term strategy to build financial security.
But fast forward to today, and the narrative has completely changed. A recent survey shows that 4 in 10 young Canadians believe they can’t afford rent because of people owning more than one home. They’ve been conditioned to blame landlords and investors instead of identifying the root cause: the government.
It’s understandable why frustration is high. Rent costs are soaring, and many feel like the system is stacked against them. But we need to ask: who would you rather have as your landlord? Do we want the government stepping in? We’ve already seen how much damage that approach has caused.
The truth is, the way forward is capitalism—but with the right incentives. Developers, landlords, and investors need fewer barriers and more opportunities to create affordable housing. Lower rents, reduced development costs, and greater accessibility allow renters to become owners and owners to invest further.
When costs come down, everyone wins. It’s simple math.
Let’s hope for meaningful changes that create opportunities for everyone to thrive.
Let’s jump into the latest market stats and insights. There’s a lot to unpack, so here we go! 

December Highlights
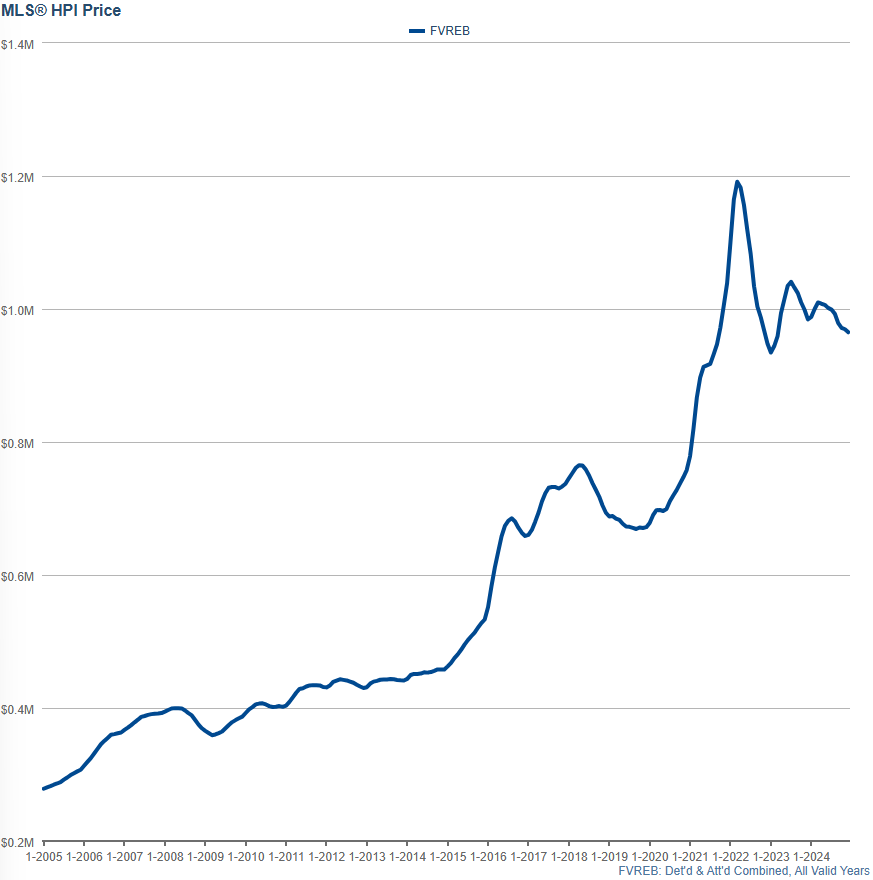
December marked the ninth consecutive month of decline in the Housing Price Index (HPI) for Detached and Attached properties, including Houses, Townhomes, Condos, Duplexes, and Row Homes in the Fraser Valley.
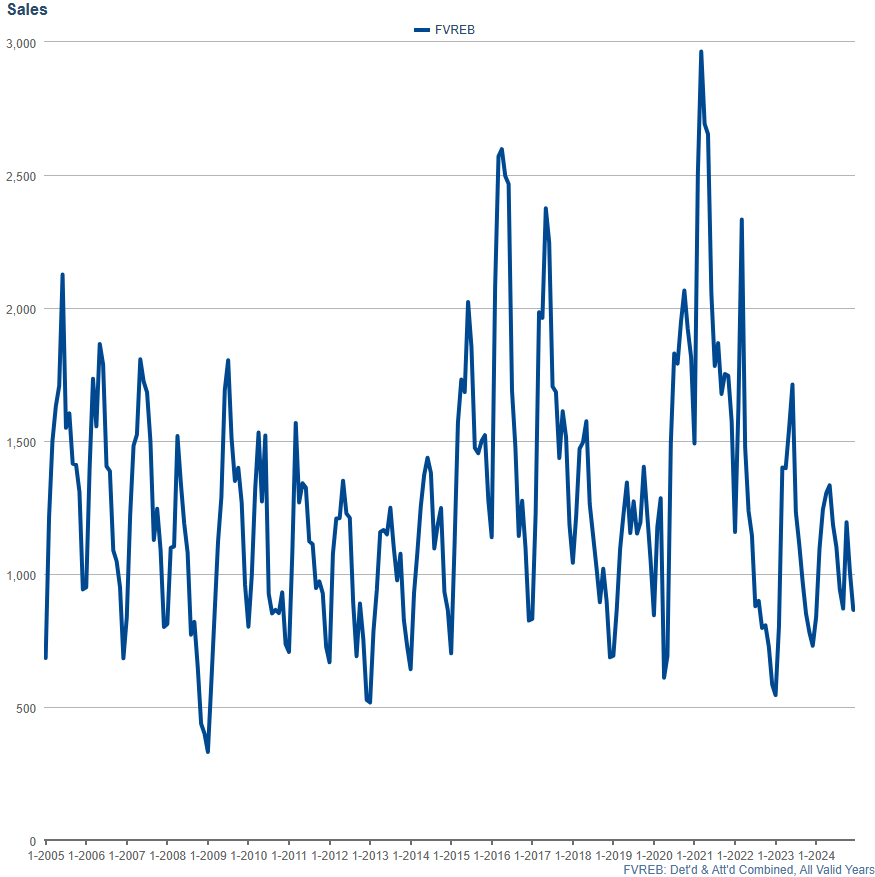
However, there was some good news—sales volume improved significantly. While November ranked as the 9th slowest November in 20 years, December flipped that narrative, becoming the 9th fastest December in 20 years. This improvement is an encouraging sign of renewed market activity.
Sales volume did decline slightly, falling from 1,007 units in November to 865 units in December, representing a 14.1% month-over-month drop. That said, a decrease in sales during December is typical due to the holiday season.
Key Stats for December
- The HPI price fell from $969,500 to $965,000 (combined Attached & Detached), representing a 0.46% month-over-month decline.
- Prices remain the same as they did in October 2021, erasing nearly three years of appreciation.
January Market Watch 
January is already shaping up to be an interesting month. Just a few days ago, there was a 65% chance of a rate cut at the end of the month, but the recent jobs report has introduced some uncertainty. The report showed a significant increase in the public sector, which could influence the Bank of Canada’s decision to hold off on cutting rates as previously projected.
Additionally, this month marks the first full calendar month to observe the impact of the new mortgage rules introduced in December. These changes have the potential to influence buyer behavior and affordability, but it remains to be seen how they will play out in the market.
Stay tuned for updates as we navigate this dynamic market together!
Price Change Recap: 

- December 2024: -0.46%

- November 2024: -0.23%
- October 2024: -0.7%
- September 2024: -1.4%
- August 2024: -0.7%
- July 2024: -0.3%
- June 2024: -0.5%
- May 2024: -1.0%
- April 2024: -0.2% (revised from +0.5%)
- March 2024: +1.4%

- February 2024: +0.9% (previously recorded incorrectly as +3.7%)
- January 2024: -0.3%
- December 2023: -1.5%
- November 2023: -1.1%
- October 2023: -1.4%
Sales Volume
November brought a decline in sales volume, which is typical for this time of year, even in normal mDecember brought a shift in sales volume, flipping the narrative from the 9th slowest November to the 9th fastest December out of the past 20 years. While not extraordinary, this represents a notable change in a positive direction as the market shows signs of renewed activity.
Sales volume for both Detached & Attached properties combined decreased slightly, falling from 1,007 units in November to 865 units in December, representing a 14.1% month-over-month decline. While December typically sees lower sales due to the holiday season, this improvement in the rankings offers some optimism moving forward.
For context, here’s how the last six months have compared historically:
- December 2023: 9th fastest December in 20 years
- November 2023: 9th slowest November in 20 years
- October 2023: 10th slowest October in 20 years
- September 2023: 5th slowest September in 19 years
- August 2023: 4th slowest August in 20 years
- July 2023: 3rd slowest July in 20 years
While the market remains slow overall, the improvement in December’s rankings is a step in the right direction. We’ll continue tracking these trends closely in the months ahead.
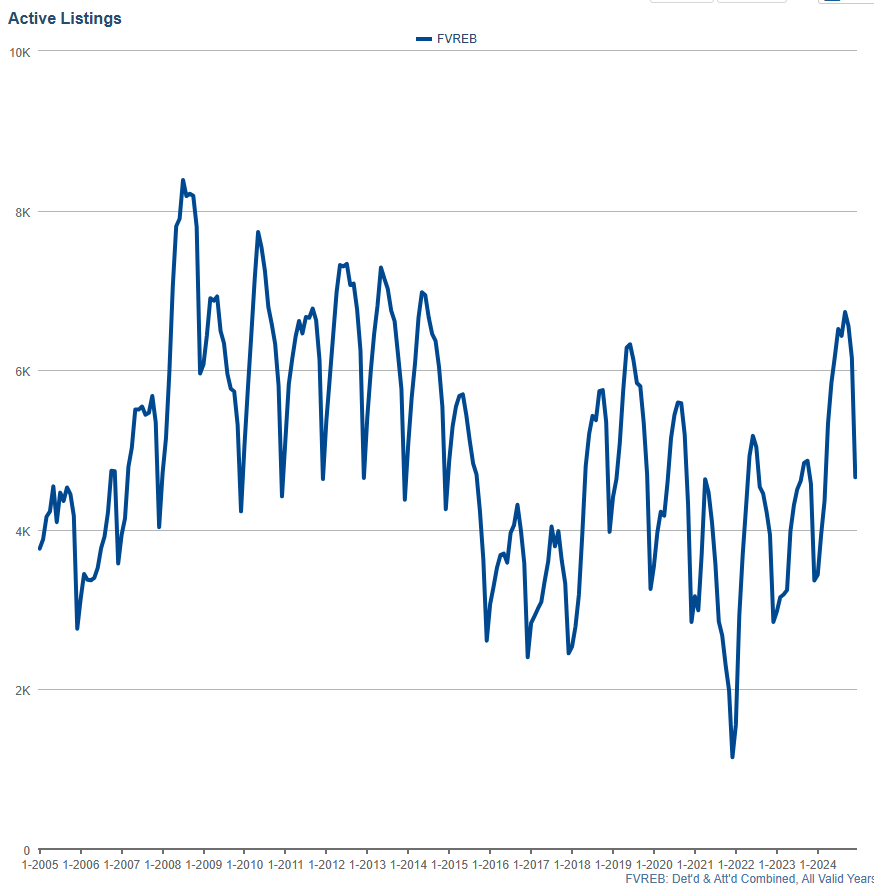
Active Listings
Listings dropped in December, falling from 6,152 in November to 4,658 in December, representing a 24.3% month-over-month decrease. This reduction is typical for the season, as December historically sees lower inventory levels.
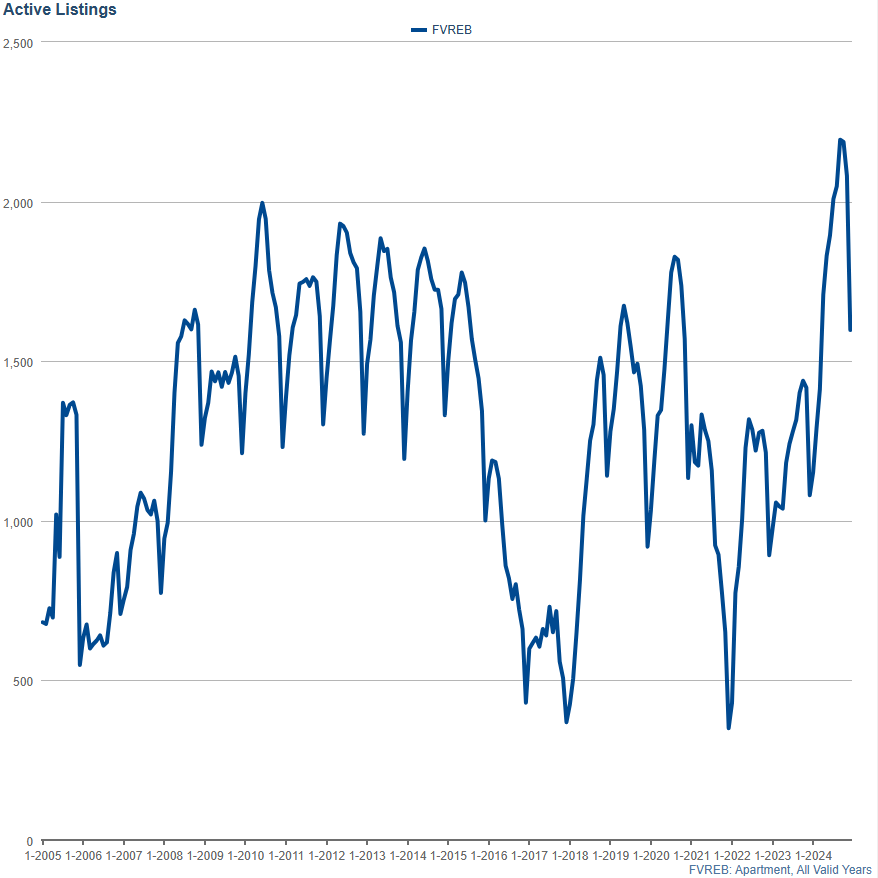
For condos specifically:
- November recorded the highest number of condo listings ever for the month, with 2,081 active listings.
- December followed suit, also recording the highest number of condos listed for any December, despite a decrease to 1,598 active listings, which represents a 23.2% month-over-month decline.
For context:
- November 2024 ranked as the 5th highest November on record for active inventory.
- December 2024 ranked as the 5th highest December in the past 20 years.
While overall listings and condo inventory have declined into December, the elevated levels earlier in the year underscore the ongoing supply and demand imbalances, particularly in areas like Surrey and Willoughby, which continue to face significant market challenges.
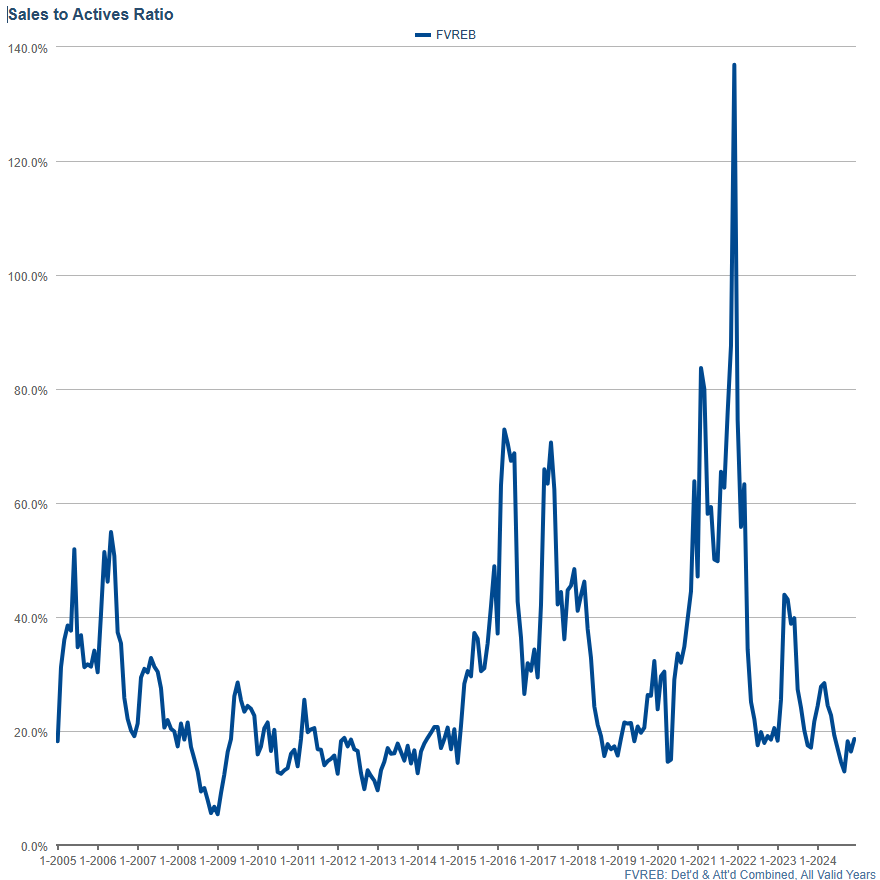
Sales Ratios 
Sales ratios (the percentage of active listings that sell in any given area) increased from 16.4% in November to 18.6% in December, reflecting a slight improvement in overall market activity. While these ratios remain relatively low, they can vary significantly depending on price point and property type.
For example:
- Condos continue to struggle, with sales ratios hovering close to 10% in several areas.
- Lower to mid-price ranges tend to see stronger demand, while the luxury segment continues to experience limited buyer interest.
This highlights the importance of understanding specific market dynamics, as sales ratios provide valuable insights into how challenging the market is for sellers in certain segments.
My Forecasting
As we enter January, the anticipated interest rate cut by the Bank of Canada has become uncertain. Earlier projections suggested a 65% chance of a rate cut this month; however, the recent addition of 90,900 jobs in December, which lowered the unemployment rate to 6.7%, has led to a reassessment. The probability of a rate cut at the Bank’s January 29 meeting has now decreased to as low as 40% in the betting markets.
While job creation often signals economic strength, it’s important to note that the vast majority of these new jobs were in the government sector. Canada has now surpassed the 25% threshold for government employment, making it one of the largest governments per capita among G7 nations. Unfortunately, this comes with significant costs, as Canada also ranks among the highest in spending per capita on healthcare and education—yet often produces some of the worst outcomes in these areas.
This raises a critical question: how much should we celebrate job creation when it primarily increases government debt, placing the burden on future generations? Private sector job growth continues to struggle under the weight of increasing taxes and regulations, further highlighting systemic challenges in the economy.
In addition to these considerations, January provides the first full calendar month to observe the impact of two major mortgage rule changes implemented in December:
- Reduced Down Payments: Borrowers can now qualify for mortgages up to $1.5 million with significantly lower down payments. For instance, a $1.5 million home now requires only a $125,000 down payment, down from the previous $300,000.
- Extended Amortizations: Amortization periods have been extended to 30 years, offering either a 12% reduction in monthly payments or a 12% increase in purchasing power.
These substantial changes are expected to influence buyer behavior and market dynamics, particularly in the mid-market home segment.
Rental Property Outlook
The rental property market remains challenging for investors. While interest rates have decreased to 3.25%, they are still above the 2.5% threshold where investors typically achieve break-even cash flow. As a result, cash flow on rental properties remains negative, making new acquisitions less attractive.
Additionally, property values have declined, with areas like Mission experiencing a 25% decrease from peak values nearly three years ago. Overall, prices have reverted to October 2021 levels, erasing recent appreciation gains.
Short-term rental platforms like Airbnb have also come under increased scrutiny from municipal, provincial, and federal governments, adding regulatory challenges for investors.
Despite these obstacles, it’s anticipated that investors will re-enter the market once interest rates decline sufficiently to allow for break-even or positive cash flow on rental properties.
I hope you found this forecast helpful!  As always, feel free to reach out if you’d like to discuss your personal real estate situation
  . I’m here to help! And if you’re curious about how much YOUR home is worth, contact me today for a no-obligation home evaluation!
